Download
1 / 13
130 likes | 269 Vues
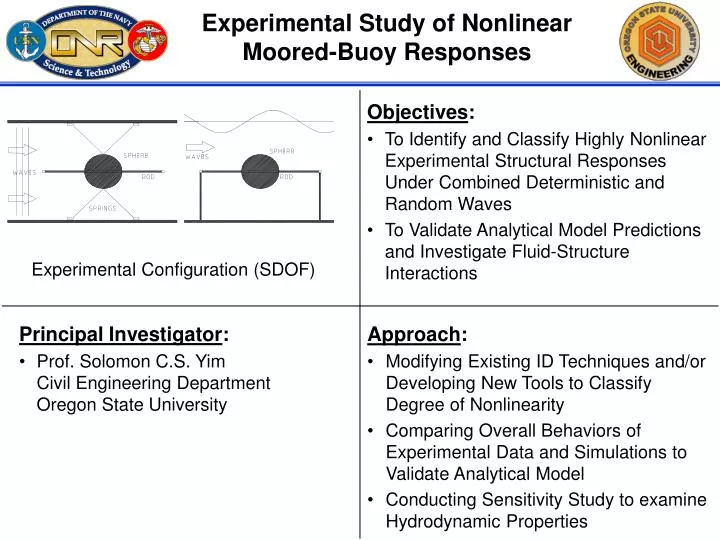
Experimental Study of Nonlinear Moored-Buoy Responses. Objectives : To Identify and Classify Highly Nonlinear Experimental Structural Responses Under Combined Deterministic and Random Waves To Validate Analytical Model Predictions and Investigate Fluid-Structure Interactions.

E N D
Experimental Study of Nonlinear Moored-Buoy Responses • Objectives: • To Identify and Classify Highly Nonlinear Experimental Structural Responses Under Combined Deterministic and Random Waves • To Validate Analytical Model Predictions and Investigate Fluid-Structure Interactions Experimental Configuration (SDOF) • Principal Investigator: • Prof. Solomon C.S. Yim Civil Engineering Department Oregon State University • Approach: • Modifying Existing ID Techniques and/or Developing New Tools to Classify Degree of Nonlinearity • Comparing Overall Behaviors of Experimental Data and Simulations to Validate Analytical Model • Conducting Sensitivity Study to examine Hydrodynamic Properties
Highly Nonlinear Experimental Structural Responses Possible Chaos (Poincare Map) • Observations: • Primary and Secondary Resonances in Frequency Response Diagram • Harmonic, Subharmonic, Superharmonic, and Possibly Chaotic Responses • Transition Behavior of Multiple Coexisting Response Attractors Possible Chaos (Poincare Time History) Coexisting Harmonics and Subharmonics
Poincare Analysis of Multiple Coexisting Responses Sections I & V Sections III & VII Sections II & VI Sections IV & VIII
Comparisons of Experimental Results and Analytical Predictions Time-Averaged PDF Numerical Model: where Frequency Response Diagram Distributions of Large Excursions
On-Going/Future Research Cd versus Reynolds Number • On-Going Research: • Identifying Best-Fit Fluid-Structure Models • Investigating Hydrodynamic Properties • Predicting Occurrence of (Noisy) Chaos • Verifying Inter-Domain Transitions as Analytically Predicted Cm versus Reynolds Number • Future Research: • Formulating Models Based on Large Body Theory • Extending Analysis Procedure to MODF Experimental Results • Comparing SDOF and MDOF Results
Stochastic Analysis of Nonlinear System under Narrowband Excitation • Objectives: • Improve accuracy of prediction using semi-analytical method • Apply semi-analytical method to nonlinear-structure nonlinearly-damped (NSND) model • Compare prediction with experimental data • Principal Investigator: • Prof. Solomon C.S. Yim • Civil Engineering Department • Oregon State University • Approach: • Identify typical nonlinear response behavior under deterministic excitation • Employ semi-analytical method to predict system response • Validate prediction method through comparison with experimental data
Stochastic Analysis of Nonlinear System under Narrowband Excitation Response under Deterministic Excitation Typical Nonlinear Response Behavior Progress: System Configuration (a) Plan view (b) Profile view Fig.1 Experimental model of nonlinear system Fig.2 Four different response behavior under same excitation Coexisting Attraction Domain Response Amplitude Curve Fig 3. Small amplitude harmonic, 1/3 subharmonic, 1/2 subharmonic and large amplitude harmonic Fig 4. Response amplitude curve of system in subharmonic region
Stochastic Analysis of Nonlinear System under Narrowband Excitation Jump Phenomena Inter-Domain Transition Fig 5. Amplitude jump from large amplitude to small amplitude harmonic domain Fig 6. Schematic diagram of inter-domain transitions Response under Narrowband Excitation Stochastic behavior of the excitation parameter Intra-Domain Transition Where, A(1),A(2) = excitation amplitude of current and next cycles, = phase angle difference, (1)-(2) Fig 7. Intra-domain transitions within four different attraction domains
Stochastic Analysis of Nonlinear System under Narrowband Excitation Numerical simulation Large amplitude harmonic response 1/2 subharmonic response 1/3 subharmonic response small amplitude harmonic response Fig 8. Time series of narrowband excitation amplitude (top) and corresponding response amplitude (bottom) Fig 9. Amplitude response map correspond to time series shown in Fig 8. Result Overall Response Amplitude Probability Distribution • Future study: • Apply semi-analytical method to NSND model • Predict response of NSND model with coefficient determined by system identification technique • Verify prediction using experimental data Fig 10. Overall response amplitude probability distributions (compared with simulation result)
Modeling and Validation of Nonlinear Stochastic Barge Motions Modeling and Validation of Nonlinear Stochastic Barge Motions Objectives: - To examine predictive capability of coupled Roll-Heave-Sway models to estimate stochastic properties of nonlinear barge response behavior - To develop probability-based analysis and design methodology FIG. 1. Roll-Heave-Sway Model Approach: - Develop Roll-Heave-Sway barge-motion models (and lower order ones) - Identify system coefficients - Examine and compare numerical predictions with measured data - Develop nonlinear extreme-value prediction techniques Principal Investigator: - Prof. Solomon C.S. Yim Civil Engineering Department Oregon State University
Modeling and Validation of Nonlinear Stochastic Barge Motions Identification of System Coefficients for Roll-Heave Model - Regular Waves Comparison of Model Predictions with Measured Data - Measured Random Waves - Simulated Random Waves measured predicted FIG. 1. Roll vs Roll Velocity (Regular Waves, Case SB27) measured predicted Future Research: - Examine complex nonlinear behavior including resonance and possible chaos - Perform and compare simulations - Use model to verify proposed theories on capsize FIG. 2. Roll vs Heave (Regular Waves, Case SB27)
Modeling and Validation of Nonlinear Stochastic Barge Motions measured predicted FIG.3. Roll Distribution (measured random waves) FIG.5. Roll vs Wave (measured random waves) measured predicted FIG.4. Heave Distribution (measured random waves) FIG.6. Roll vs Heave (measured random waves)
Modeling and Validation of Nonlinear Stochastic Barge Motions measured predicted FIG.7. Roll Distribution (simulated random waves) FIG.9. Roll vs Wave (simulated random waves) measured measured FIG.8. Heave Distribution (simulated random waves) FIG.10. Roll vs Heave (simulated random waves)