Download
1 / 58
580 likes | 591 Vues
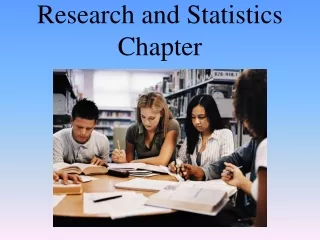
Research and Statistics. AP Psychology Helpful review site link. Questions:. On Socrative ……Why do scientists conduct research?. Things that limit human intuition (activity pg.3):. Hindsight Bias . Over Confidence. Activity 2-3 (next slide)

E N D
Research and Statistics AP Psychology Helpful review site link
Questions: • On Socrative……Why do scientists conduct research?
Things that limit human intuition (activity pg.3): Hindsight Bias Over Confidence Activity 2-3 (next slide) Def: the tendency to think we know more than we do. We are more confident that correct These lead us to over estimate our intuition! • Also known as the knew it all along phenomenon. • Common sense describes what has happened rather than what will happen • Def: our tendency to believe, after we’ve learned the outcome, that we could have foreseen it.
4 Main Goals of Psychological Research: • Describe a phenomenon • Make predictions aboutthe phenomenon • Control variables • Explain phenomenon with some degree of confidence
In order to conduct good psychological research one must: • Use the scientific method. • Have a clear operational definition. • It is often NOT sufficient to describe a runner • as “fast,” a basketball player as “tall,” a wrestler as “strong,” or a baseball hitter as “good.” (see next slide for GOOD example) • Allows for replication. • It is the definition of the phenomenon that is being studiedand how the scientists measure it. • Have informed consent. • Follow APA guidelines.
Good Example of OD • For example, anxiety could be defined in dictionary terms as “a state of being uneasy, apprehensive, or worried.” • An operational definition of the term could include observable measures such as sweating palms (observable as sweat gland activity), increased heart rate (observable with heartbeat recording), dilated pupils, and other observable physiological changes. • It could also be a self-rating scale or a paper-and-pencil questionnaire. • We could in each case specify the precise amounts of each measure necessary for our operational definition of anxiety.
Various Types of Research MethodsVideo • Descriptive Research: Scientists use naturalistic observations, case studies, and surveys to describe and predict behavior and mental processes.
Various Types of Research Methods • Correlational Research: predicts naturally occurring relationships.
Various Types of Research Methods • Experimental Research: Scientists use experiments to control variables and to establish Cause and Effect Relationships (in which one variable can be shown to have caused a change in another.)
How do I pick the people to study? • Pick a sample of people from a population so that you can generalize your findings. (Regardless of research design) • Population Random Sample Random Assignment Control Group OR Experimental Group • Larger samples yield more reliable results (External Validity)
Understanding Sampling • Population (who we want to study) • Random Sample (who we ACTUALLY study) • Randomly assign samples to • Control Group OR • No experimental treatment (Placebo) • Experimental Group • Receive the experimental treatment
Naturalistic Observation: Seeing subjects in natural environment Best way to gather descriptive data. Problem- when people know that they are being watched, they act differently. (Hawthorn effect) Test 1 Video 1 Video 2 Case Studies: Intense examination of a phenomenon. Useful when something is new and complex. Problem- limited to what researchers consider important. DescriptiveResearch
Descriptive Research: Surveys • Examples • Researchers use questionnaires and interviews to gather information about behavior, beliefs, and opinions. • Gives a broad view of a large group. • Validity depends on representativeness and how questions are worded. • Problem- people are reluctant to say what they really believe, say what is desired.
Correlation Research: • Used to say that two traits or behaviors accompany one another and the Correlation Coefficient measures the relationship between the two. (it reveals the extent to which two things relate.) • Correlation does not mean Causation!!! • Look at these graphs to help you understand this point • Types of correlation: • Positive- two variables same direction • Negative- two variables opposite direction
Correlation Research: • Correlations are illustrated by scatterplots: • Each dot is a score (value of two variables)
Correlation Coefficient • A number that measures the strength of a relationship. • Range is from -1 to +1 • The relationship gets weaker the closer you get to zero. Which is a stronger correlation? (socrative) -.13 or +.38 -.72 or +.59 -.91 or +.04 Illusionary Correlations lead us to believe there is a relationship when there really is none. (next slide example)
From PsyBlog: • http://www.spring.org.uk/2013/05/illusory-correlations-when-the-mind-makes-connections-that-dont-exist.php
Review Question: 1. In order to yield information that is generalizable to the population from which it was drawn, a sample must be (A) made up of at least 30 members of the population (B) as large as possible (C) normally distributed (D) representative of the population (E) made up of at least 50 percent of the members of the population
Review Question: A study can be regarded as scientific only if (A) it utilizes an effective placebo (B) its findings are accepted by experts in the field (C) its findings are consistent with established theories (D) its conclusions are based on strong correlational data (E) its conclusions can be verified or refuted by subsequent studies
Experiments: • Only method that establishes a Cause and Effect relationship. • Allow researchers to almost fully control variables. • By changing, adding, or removing variables, researchers view effects. • Types of Variables: • Independent- Changed, added, or removed factor. • Dependent- factor that is observed and measured. (depends on the change, addition or removal of the independent variable) • Confounding a.k.a. Random Variables-uncontrolled factors in research design. (see next slide)
Example of Confounding variables: • http://www.psychologyandsociety.com/confoundingvariable.html • Read this then respond with a CV for this: (see next slide)
Identify some possible CVs A researcher wanted to find out if studying in natural light was more effective than studying in artificial light. Two groups of volunteers were given the same history topic to learn in three hours, from 1pm until 4pm. One group studied the topic outside in natural light, and the other in a room with no windows and only fluorescent light. After three hours of studying, both groups were tested on how much they remembered of the history topic.
Control Measures: • Placebos • Single Blind • Double Blind • Random Assignment • WHY? • TO CONTROL FOR CONDOUNDING VARIABLES!
Experimental Method: • 1. Observe some aspect of the universe. • 2. Invent a tentative description, called a hypothesis, that is consistent with what you have observed. • 3. Use the hypothesis to make predictions. • 4. Test those predictions by experiments or further observations and modify the hypothesis in the light of your results. • 5. Repeat steps 3 and 4 until there are no discrepancies between theory and experiment and/or observation.
So what do I do with these subjects? • Through Random Assignment…….. • One group gets the PLACEBO. • Control Group • Other group gets the Experimental product. • Experimental Group • WHY?????? • TO CONTROL FOR CONFOUNDING VARIABLES
Comparing Research Methods Video Review
So now, what do we do with all the data collected??????? • We use STATISTICS! Yay…..
Important stuff to know about data… • In order for data to be considered worthy or good, sound data it must be… • Reliable- stable and consistent • Valid- it is reporting what it set out to report
Statistics: • Statistics are methods for demystifying and making meaning from data. • Graphing allows us to see some level of meaning from numbers. (Pie Charts, Line Graphs, Frequency Polygon) • Types of Statistics: • Descriptive • Inferential
Descriptive Statistics: • Used to describe and present data. • They can tell us the difference between two or more groups. • Basic categories of DS are • 1. Central Tendency • 2. Variability • 3. Correlation- sometimes in a class of its own.
Descriptive Stats:Central Tendencies • A way to describe the typical or average score distribution. • Mean- average, can be skewed by extreme scores. • Median- best indicator of central tendency, middle score. Least affected by extreme scores. • Mode- Most frequently occurring score.
Before we go on…Let’s practice with Scientific Method and Central Tendencies • Question: What options does Mars Co have when filling bags of M&Ms in regard to color? (remember to operationalize) • Hypothesis: FIXED…..RANDOM…..You decide! • Make predictions. • Test those predictions by experiments or further observations and modify the hypothesis in the light of your results.
Choose a sample from the population….. • Propose a hypothesis by recording a % on worksheet. (f = frequency) Calculate %. • Observe and record actual colors in your sample. (how closely do they match?) • Will you alter your hypothesis? • Get into groups of 5 people. Record data. • Will you alter your hypothesis? • Get into 2 big groups. Record data. • Will you alter your hypothesis? • Get into 1 group. Record data. • Will you alter your hypothesis?
So what… • ….does this tell us about sampling? • …does this tell us about randomness? • …does this tell us about the relationship between research and statistics?
Graphs are used to see data meaningfully: • Types of graphs: • Bar graph • Histogram • Pie Chart • Bell curves- see this site for info on skewed, outliers, etc. (Example in Resource binder)
Things to remember about the Normal Curve: • Large numbers of data often form these. • Most cases fall near the mean. • 68% of all scores fall 1 standard deviations from the mean. (Deviation think distance from mean) • 95% of all scores fall 2 standard deviations from the mean. • 99.7% of all scores fall 3 standard deviations from the mean.
Descriptive Stats:Variability • Indicates how much spread there is in a distribution. • Range- difference between lowest and highest score. Most effected by extreme scores. • Variance- how different scores are from each other. • Standard Deviation- most common measure of variability. (how far each value is from the mean.)