Download
1 / 34
340 likes | 439 Vues
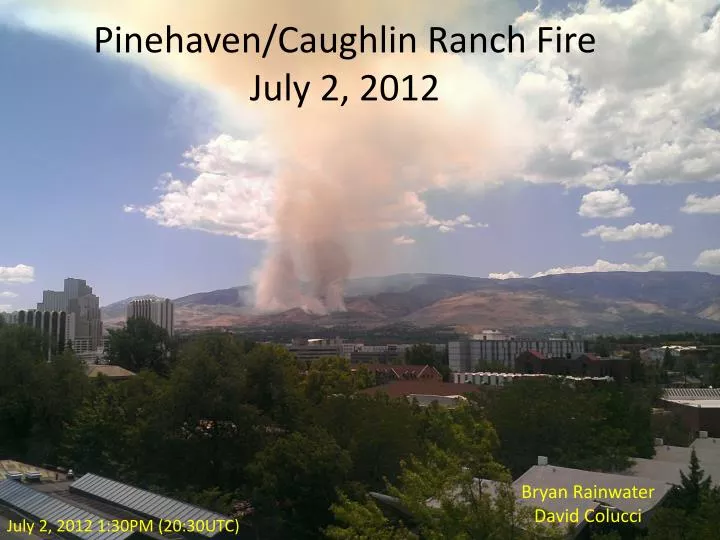
Pinehaven / Caughlin Ranch Fire July 2, 2012. Bryan Rainwater David Colucci. July 2, 2012 1:30PM (20:30UTC). Objectives. Observe the Pinehaven / Caughlin Ranch Fire beginning on July 2, 2012 at about 1PM local time .

E N D
Pinehaven/Caughlin Ranch FireJuly 2, 2012 Bryan Rainwater David Colucci July 2, 2012 1:30PM (20:30UTC)
Objectives • Observe the Pinehaven/Caughlin Ranch Fire beginning on July 2, 2012 at about 1PM local time. • Analyze the University of Nevada AERONET data that intersects the smoke plume. • Acquire and analyze MODIS and CALIPSO data. • Acquire dispersion characteristics from the HYSPLIT model with the NAM12K meteorological data and verify accuracy using on site LIDAR and CIMEL readings.
Pinehaven/Caughlin Ranch Fire • July 2, 1:00PM • fire started from suspected arson according to fire officials. • July 2, 1:30PM • Fire crews arrived on site with under 100 acres burning • July 2, 4:30PM • containment had been mostly achieved, with an estimated 200 acres burned. • July 3, 9:15AM • fire crews achieved 90 percent containment. • July 3, 1:30PM • fire had been fully contained having burned 206 acres. July 2, 2012 1:22PM *Photo Courtesy of Ben Sumlin
Satellite Imagery of the Fire Terra Sensor
Modis Terra Satellite Image July 2, 2012 (11:10AM) Modis Aqua Satellite Image July 2, 2012 (2:30PM)
CALIPSO LIDAROrbital Path July 3, 2012 July 2, 2012
Satellite Remote Sensing Limitations (in sight of recent developments) • Lack of necessary pixels, appropriate resolution, or swath size. • Algorithm Errors that lead to problematic data. • Inability to continuously correct for surface and ocean albedo, elevation gradients, ocean glint • Vertical resolution needs improvement on current sensors. • Inability to identify vertical distribution of atmospheric components (unless intersected by CALIPSO) • Several sensors are far past their predicted lifetime and working (but for how long?) • Sensors are experiencing losses of data (OMI) • Sensors will fall out of orbit eventually though some sooner than others (PARASOL)
Future Improvements • Numerous scientific programs and teams are working on independent algorithm corrections and model improvements. • Computer processing limitations are being overcome • Remote sensing understanding is constantly improving • Algorithms for pixel “smoothing” are being worked on • Help in understanding vertical resolution is being worked on • Levels of data processing are constantly improving to allow for additional land, ocean, atmosphere, climate, etc. products. • Correlating ground and satellite based sensors data • Incorporating local meteorological data • More sensors will be lunched for additional and improved satellite data
Future Improvements/Missions Blue – ESA sensors Red – Japanese sensor Green – Geostationary Taken from NASA ARSET Webinar Series Presentations
Conclusions • CIMEL level 1 data proved to be reliable to study the smoke plume passing through the column • Limitations of Remote Sensing • Lack of CALIPSO data • Smear of AOD data across a large area via MODIS • Lack of reliable AOD pixels • Inability to recognize smoke on both CIMEL data and on MODIS imagery • Lack of resolution for relatively small scale burn events (206 acre fire) • HYSPLIT’s Dispersion Model passed over the University for the time in which we physically observed smoke • The Smoke Verification Tool is very rough when compared with the HYSPLIT Dispersion Model