Download
1 / 4
40 likes | 213 Vues
Dependencia de la humedad de saturación (q*) con la temperatura (T). Pendiente crece con la temperatura. Dependencia de la adiabática húmeda con temperatura a presión constante. 2xCO2. IPCC-AR4.

E N D
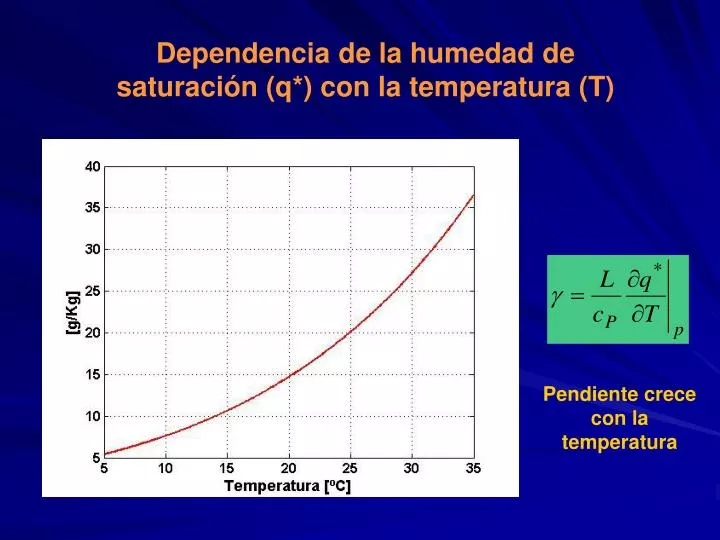
Dependencia de la humedad de saturación (q*) con la temperatura (T) Pendiente crece con la temperatura
Dependencia de la adiabática húmeda con temperatura a presión constante
2xCO2 IPCC-AR4 Figure 9.20.Comparison between different estimates of the PDF (or relative likelihood) for ECS (°C). All PDFs/likelihoods have been scaled to integrate to unity between 0°C and 10°C ECS. The bars show the respective 5 to 95% ranges, dots the median estimate. The PDFs/likelihoods based on instrumental data are from Andronova and Schlesinger (2001), Forest et al. (2002; dashed line, considering anthropogenic forcings only), Forest et al. (2006; solid, anthropogenic and natural forcings), Gregory et al. (2002a), Knutti et al. (2002), Frame et al. (2005), and Forster and Gregory (2006), transformed to a uniform prior distribution in ECS using the method after Frame et al. (2005). Hegerl et al. (2006a) is based on multiple palaeoclimatic reconstructions of NH mean temperatures over the last 700 years. Also shown are the 5 to 95% approximate ranges for two estimates from the LGM (dashed, Annan et al., 2005; solid, Schneider von Deimling et al., 2006) which are based on models with different structural properties. Note that ranges extending beyond the published range in Annan et al. (2005), and beyond that sampled by the climate model used there, are indicated by dots and an arrow, since Annan et al. only provide an upper limit. For details of the likelihood estimates, see Table 9.3. After Hegerl et al. (2006a).
IPCC-AR4 Figure 8.14. Comparison of GCM climate feedback parameters for water vapour (WV), cloud (C), surface albedo (A), lapse rate (LR) and the combined water vapour plus lapse rate (WV + LR) in units of W m–2C –1. ‘ALL’ represents the sum of all feedbacks. Results are taken from Colman (2003a; blue, black), Soden and Held (2006; red) and Winton (2006a; green). Closed blue and open black symbols from Colman (2003a) represent calculations determined using the partial radiative perturbation (PRP) and the radiative-convective method (RCM) approaches respectively. Crosses represent the water vapour feedback computed for each model from Soden and Held (2006) assuming no change in relative humidity. Vertical bars depict the estimated uncertainty in the calculation of the feedbacks from Soden and Held (2006).