Download
1 / 30
300 likes | 422 Vues
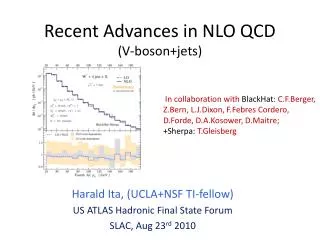
ttbar τ + jets : Update on QCD Estimation. William Edson SUNY at Albany. PDF Unc. The PDF uncertainty of an observable can be evaluated basically in three ways:

E N D
ttbarτ + jets:Update on QCD Estimation William Edson SUNY at Albany
PDF Unc. • The PDF uncertainty of an observable can be evaluated basically in three ways: • Intra-PDF uncertainty: this is the uncertainty within a given PDF set. E.g. the PDF that is used for the generation of a sample has an uncertainty and this uncertainty propagates to the uncertainty of the observable. Usually a certain PDF is accompanied by a set of error PDFs (PDF error set) and there is a PDF-dependent prescription how to evaluate the PDF uncertainty using these error PDFs. • Inter-PDF uncertainty: this is the variation when switching from one PDF (set) to another PDF. The comparison is made using the best fit PDF (or central value) for each PDF and compare the variation of the observable • Full-PDF uncertainty: this is the combination of the inter and intra-PDF uncertainty. A procedure has been agreed on by the PDF4LHC working group how to combine the both uncertainties. This is the so-called envelope of the variations and uncertainties
Cross Section Results NNPDF CT10 MSTW Fit Results: Mean: 1.77000e+02 Sigma: 6.43115e-01 Fit Results: Mean: 1.77462e+02 Sigma: 4.31322e-01 Fit Results: Mean: 1.77317e+02 Sigma: 1.20957e+00
Intra-PDF Uncertainty • CT10: • Symmetric Hessian, in addition reduce the uncertainty by 1.645 to correspond to 68 % C.L. errors • delta X = 0.5 * sqrt( sum ( (X_i+ - X_i-)^2 ) ) • MSTW: • Asymmetric Hessian, check pairwise, if the uncertainty is a variation up or variation down and add them correspondingly to the error up or error down, but if X_2i and X_2i-1 are both in one direction, just use the larges • errorup=sqrt( sum_i (max(0,X_2i-X_0,X_2i-1-X_0)^2 ), check for i=1..N/2 • errordown=sqrt( sum_i (max(0,X_0-X_2i,X_0-X_2i-1)^2 ), check for i=1..N/2 • NNPDF: • The best value is the mean of all the ensembles and the uncertainty is the standard deviation
Intra-PDF Uncertainty Results • CT10: • ± 2.49152 • MSTW: • + 1.40766 / - 1.48663 • NNPDF: • ± 1.27205
Inter-PDF Unc and Envelope • All uncertainties are combined in a linear way, this is the extremum (min and max) of all variations is taken and the half of the interval is the uncertainty. This is also called the envelope. Please see the attached plot as an example of what is meant by the envelope.
Envelope Results Therefore the final uncertainty is equivalent to the CT10 Intra Unc: ± 2.49152
Fit Selection Results • New Results for Fit: • Signal Fraction: 0.691497±0.0411817 • Chi2: 28.25 • Meas. Used: 31 • σ: 166.798±9.93353 • New Corrected Results: • Signal Fraction: 0.691158 ± 0.0411817 • σ: 166.716 ± 9.93353 • Correction Systematic: ± 9.83197
Fit Selection Results • Final Result: • σ: 166.716 ± 5.897% (stat.) ± [to be calculated] (syst.)
QCD Bin/Range Range increases/decreases in steps of 20GeV Bin amount increases/decreases in steps of 5
MC Generator 1.1)fullsim mc11c POWHEG+fPythia sample 117050 (SYST_Full_117050) and MC@NLO+fHerwig sample 105200 (MC@NLO(105200)) 1.2)fullsim mc11c POWHEG+fPythia sample 117050 (SYST_Full_117050) and the fullsim mc11c ALPGEN+HERWIG samples (AlpHerwig(baseline)) 1.3) AtlFast2 mc11b POWHEG+fPythia sample 117050 (SYST_AtF_117050) POWHEG+fHerwig sample 105860 (SYST_AtF_105860)
Y(0): -0.127757 ± 0.00142161 Slope: 1.18358 ± 0.00252649 Chi2: 34.4482 NDF: 8997 Linearity Testto All Values
MC Tau Plots MC Tau Children Count MC Tau Count MC Tau Children pdgID LeptonicpdgID values: e → 11, μ → 13, τ → 15
MT Signal vs Control vs MC Backgrounds Samples Normalized to Own Integrals Samples Normalized to Sum of Integrals
Cutflow • C0: GRL • C1: Trigger • C2: Primary vertex with ntracks > 4 • C3: Electron/muon overlap • C4: Jet cleaning • C5: Lepton Veto • C6: tau n ≥ 1 • C7: njets >= 4 with eta < 2.5 and |jvf| > 0.75 • C8: MET > 60GeV • C9: MT < 80GeV • C10: >= 1 bjet • C11: Trigger matched tau n ≥ 1 and pT >= 40GeV • C12: MC tau object match
Chi-squared minimization • Equation: • N(x): total number of events of type x for distribution • n(x)i: number of events in bin of type x • frac(Sig): fraction of N(Remain) expected to be Signal • binfrac(x)i: fraction of events in bin of type x expected from MC or template • σi: uncertainty in bin i
Chi-squared minimization cont. • σi determined using factors for: • bin error: • data • signal, MC • QCD template • other backgrounds, MC • statistical error: • data: signal region • other backgrounds, MC • signal, MC • QCD template (uncertainty of background region data and all MC background region carried through via default SumW2
Highest pTbjet reconstruction • Results for plot: • chi-square: 9.818 • p-value: 0.7753 • ndf: 14 • chi/ndf: 0.7012
2nd Highest pTbjet reconstruction • Results for plot: • chi-square: 13.66 • p-value: 0.5517 • ndf: 15 • chi/ndf: 0.9107
Dijet Mass reconstruction • Results for plot: • chi-square: 15.47 • p-value: 0.6297 • ndf: 18 • chi/ndf: 0.8594
MET • Results for plot: • chi-square: 15.87 • p-value: 0.1971 • ndf: 12 • chi/ndf: 1.323
Closest pTbjet reconstruction • Results for plot: • chi-square: 14.39 • p-value: 0.2123 • ndf: 11 • chi/ndf: 1.308
New Event Selection Verification (Only uses MC so Excludes QCD)