Download
1 / 4
40 likes | 138 Vues
Coxsackie Virus and its effect on the Arf1 protein Ani Chintalapani & Matthew Hanna. A joyous day in the Life Science Center of Rutgers Newark. Fig.2 2 hr. Fig.1 0 hr. Fig.3 4 hr. Fig 1-Fig 5.

E N D
Coxsackie Virus and its effect on the Arf1 proteinAni Chintalapani & Matthew Hanna A joyous day in the Life Science Center of Rutgers Newark
Fig.2 2 hr Fig.1 0 hr Fig.3 4 hr Fig 1-Fig 5. This shows the timeline for the Arf1 protein during viral infection. Green spots are GFP tagged Arf1. The large fluorescing spot in Fig 1 and Fig 2 are the Golgi apparatus. In Fig 3, the spots are ARf1-GTP bound to the ER exit domains and partial remaining Golgi. The Golgi further gets reabsorbed by the ER as seen by the dispersion of ARf1 in Fig 3-Fig 4. Continuning infection spots begin to increase in size, quantity, and fluorescence—they also begin to move towards the nucleus due to a shrinking of the ER. Fig 5- HeLa cells have about an eight hour life span, the cell is on the verge of lysing. Fig.4 6 hr Fig.5 8 hr
Fig. 1 Fig. 2 • Fig 1. FRAP experiment graph • A baseline of fluorescence • Photobleaching (arrow) • Recovery fluorescenct • Fluorescence recovery plateau • The percentage of fluorescence lost • (Y) Amount of fluorescence regained Fig 2. The first three data point are the fluorescent before photobelaching. Then the image was photobleached and real time images were taken over a few minute period. Data analysis includes normalization for different cell sizes. When photobleached, the fluorescence reduces significantly. Over time, the amount of Arf1 protein increases after the photobleach and Arf1 recovers its fluorescence; it eventually plateaus. The percent recovery uses the formula: (Y/ X) x 100 = % recovery.
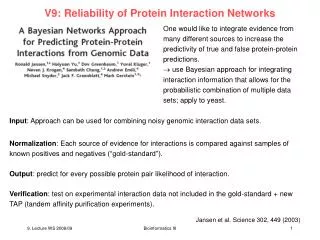
-From the equations we will analyze several important questions: • -What are the fixed points? • What is the stability of those fixed points? • How does the fixed points depend on the parameters? • What does the fixed points mean from a biological standpoint? • What parameters need to be changed so that the model fits the biological phenomenon at various points of infection? Mathematical model dXf/dt= -k1*Xf + kappa*(F – Xf)*( S - Xf + Xu) dXu/dt= -k1*Xu + kappa*(U – Xu)*(S-Xf+Xu) Variables: Xf = fluorescent Arf-GTP Xu= unlabeled Arf-GTP Parameters: k1 = off rate of Arf-GTP to Arf-GDP Kappa= on rate of Arf-GDP to Arf-GTP F = total Flourescent Arf in the cell U = total Unlabeled Arf in the cell S = total number of sites on the cell Xf(0) = initial number of fluorescent Arf-GTP Xu(0) = intial number of unlabeled Arf-GTP