Download
1 / 115
1.15k likes | 1.32k Vues
CAPITAL IMPROVEMENTS PLAN Department of Public Works Capital Improvements Committee March 3, 2010. Jeffrey J. Mantes – Commissioner Preston D. Cole – Director of Operations Jeffrey S. Polenske – City Engineer. MISSION

E N D
CAPITAL IMPROVEMENTS PLANDepartment of Public WorksCapital Improvements Committee March 3, 2010 Jeffrey J. Mantes – Commissioner Preston D. Cole – Director of Operations Jeffrey S. Polenske – City Engineer
MISSION • To promote the health, safety, mobility, and quality-of-life for all City of Milwaukee residents and visitors by providing: • Safe, attractive, and efficient surface infrastructure systems; • Solid waste collection, disposal, recycling, and waste reduction; • Safe, aesthetically pleasing, and sufficient drinking water; • Storm water and waste water conveyance; and, • Support services and facilities for the Department of Public Works (DPW) and other city departments Clinton Street and Lincoln Avenue 6-8-28
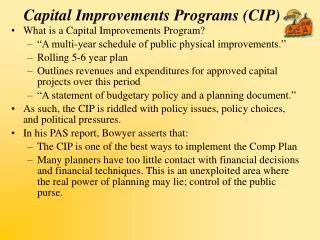
C. CAPITAL IMPROVEMENTS EXECUTIVE SUMMARY MISSION: To maintain and enhance the city’s infrastructure in a cost efficient and effective way to ensure that the city remains economically competitive. OBJECTIVES: Prepare a six year capital improvements plan to identify long range capital needs and to establish spending, debt, and tax levy goals. Develop investment strategies to ensure favorable rates of return on city capital investments. STRATEGIES: Match capital borrowing to debt retirements in order to manage the debt levy and enhance the city’s financial flexibility. Furnish information and recommendations to the reformed Capital Improvements Committee for the preparation of the 2010-2015 Capital Improvements Plan and the 2011 budget process. Cherry St Bridge
PARKING FUND Parking Structures Parking Meters Surface Parking Lots
Parking Structures • Milwaukee/Michigan(1957) 500 spaces • 2nd/Plankinton(1961) 473 spaces • MacArthur Square(1967) 1,437 spaces • 4th / Highland(1988) 980 spaces • 1000 N Water(1992) 1,493 spaces -Annual structural inspections by licensed engineers -Average capital needs of $1M annually -Generate annual revenues over $5.6 million
Parking Meters • Single Space – 4,362 meters • Multi-Space – 217 meters -Replacing single space meters charging $1+ p/hr with multi-space meters -$1 million estimated total in 2011-2012 for UWM and Marquette University areas -Generate annual revenues of $5M+
Surface Lots (45) • Metered lots • Permit lots • Leased lots • Mixed use lots -General repairs typically funded through O&M -No new lots anticipated to be built -Generates <$100k in annual revenue
Public Safety Communications • CITY-WIDE PAVING PROJECTS - $50,000 -Temporary and/or permanent network improvements associated with paving projects. • GENERAL ENGINEERING - $50,000 -Planning, design, estimates, and reports related to the program. • DATA NETWORK EXPANSION - $350,000 -Provides new or diverse connections to over 150 City facilities. • TELEPHONE SYSTEM EXPANSION - $50,000 -Ongoing maintenance and phased upgrades to over 5,000 phones lines.
City of Milwaukee Department of Public Works Major Bridge Program
Inventory and Classification 176 City-owned and maintained bridges Relative comparison of bridge types:
Rehabilitation and Replacement Program • Bridge Structure Inspection • In accordance with FHWA and WisDOT standards • Conducted by DPW personal • FHWA certified Bridge Inspectors • Bridges inspected every 24 months, except: • Annually for: • Movable bridges • Structurally deficient bridges
Rehabilitation and Replacement Program Report: Photographs: • Standardized inspection reports • Submitted to WisDOT and entered into their database • Highway Structures Information (HSIS) database generates a bridge Sufficiency Rating (SR)
Sufficiency Rating (SR) FHWA Coding Guide • FHWA standard measures service condition • Three separate group factors determine SR Rating • Structural adequacy (Deck, Superstructure, and Substructure) • Serviceability and functional obsolescence • Essentiality for public use • Condition and function are rated to current standards (not what the bridge may have been built to)
Sufficiency Rating • 100 percent would represent an entirely sufficient bridge; 0 is insufficient or deficient bridge • Rating is not a quantitative measure of safe versus unsafe • Example, a 50 year old bridge may be structurally adequate but deficient due to current roadway widths, standards, or clearance
Sufficiency Rating (SR) • Sherman Boulevard • Over West Silver Spring Drive • SR = 45.2 • Juneau Avenue • Over Milwaukee River • SR = 2.0 • 68th Street • Over Honey Creek • SR = 80.8 • Granville Road • Over Little Menomonee River • SR = 22.4 • Cherry Street • Over Milwaukee River • SR = 98.9 • North Avenue • Over Canadian Pacific Railroad • SR = 32.0 • Wells Street • Over Milwaukee River • SR = 59.1 100 75 50 25 0 Sufficient Deficient Sufficiency Rating • Bridge rehabilitation/replacement prioritized by SR and overall condition
Milwaukee Bridge Performance • SR of bridge inventory trending upwards
Milwaukee Bridge Performance • Relative comparison of SR for city rated bridges, 2008 • Federal/State funding eligibility • SR < 80.0 : Bridge eligible for rehabilitation • SR < 50.0 : Bridge eligible for rehabilitation or replacement
Bridge Funding Sources • Federal/State Program • Available only for those bridges deemed as federally eligible • Competitive application process for limited state-wide program dollars • Applied for on a 3 year cycle • Generally 80% Federal/State funded with 20% local share • Project schedule generally established by limits on available funding
Bridge Funding Sources • Local Program • Bridges not deemed Federal/State eligible • Bridges in which Federal/State funds not available or insufficient • Maintenance work including structure repair, painting mechanical upgrades, inspections, pre-engineering activities, etc.
Pavement Performance Measured on a 2 to 9 scale Pavement Quality Index (PQI)
PMA background For over 10 years the City of Milwaukee has collected condition data on the entire network that is analyzed within Stantec’s Pavement Management Application (PMA) to provide an objective assessment of the City’s road network.
Distress Measurements • Patching • Potholes • Rippling & Shoving • Raveling/Streaking • Flushing & Bleeding • Distortion • Excessive Crown • Progressive alligator cracking • Longitudinal cracking • Wheel Track Rutting • Scaling • Raveling & Weathering • Polishing • Distortion/Frost Heave • Coarse Aggregate Loss • Joint Sealant Loss • Joint spalling and faulting
Network present status PERFORMANCE INDICATORS Data defined for analysis a : PQI by Lane-Miles 30 25 20 % Network Subset 15 10 5 0 0.0-0.9 1.0-1.9 2.0-2.9 3.0-3.9 4.0-4.9 5.0-5.9 6.0-6.9 7.0-7.9 8.0-8.9 9.0-10.0 PQI Range PQI Range: 0.0-0.9 1.0-1.9 2.0-2.9 3.0-3.9 4.0-4.9 5.0-5.9 6.0-6.9 7.0-7.9 8.0-8.9 9.0- 10 Sections: 0 0 119 148 206 314 453 715 559 66 2580 %: 0.0 0.0 5.3 5.7 7.9 11.8 17.6 27.6 21.4 2.5 Ln-mi x 10 : 0.0 0.0 2.6 2.8 3.8 5.7 8.5 13.2 10.3 1.2 48.0
Major & Minor Arterials Pavement Type Principal Arterials:
2009 Service Life Estimate Existing pavements of local streets:
Traffic Control ProjectTraffic Signals & Signs W. North Ave and 3rd Street
Traffic Signal Facilities • 742 Signalized Intersections • 706 Intersections Fully Converted to LED Signal Indications • 246 Intersections with Fire Preemption Active • 13 Flashing Beacons
2009 Manual onUniform TrafficControl Devices Federal Effective Date: January 15, 2010 Must Be Adopted into State Law Before Becoming Effective in Wisconsin (Est. 2010) Source: FHWA
Changes in MUTCD Standards • Sign Standards • New Retroreflectivity Standards require replacement of over 40% of existing signs by 2015Equipment Installed Must Comply with New MUTCD Provisions • Changes in sign size, placement and content • Signal Standards • Changes in signal mounting, locations, size, types and configuration
Cost of Uncollectable Traffic Sign and Signal Knockdowns (2004 through 2008)
Street Lighting Program
Street Lighting Facilities • 1,300 Miles of Lighted Streets • 248 Substations and Enclosures • 67,229 Street Lights • 28,290 Series Lamps • 38,939 Multiple Lamps • 8,931 Alley Light • 569 Specialty Lights
Master Control System Replacement • Advanced Computer Based Master Control System currently being deployed • Operational at 33 stations; 46 stations currently under design • Controls street light on and off times • Fail safe system at each enclosure to turn lights on and off if communication system fails • Monitor operation of each street lighting circuit
Street and Alley Light Upgrades
Series Circuit Replacement Outdated Technology Used Initially in the late 1910’s and Early 1920’s Aging Cable Plant Prone to Failure Transition Began to More Modern Multiple Circuitry in the 1950’s Approximately 58% of Circuitry Converted to Multiple 60 year replacement cycle at annual cost of $1,000,000 per year
Cost of Uncollectable Street Lighting Equipment Knockdowns (2004 through 2008)
Underground Conduit Program • Provides reliable cable route for City communication network, traffic control and street lighting that supports • MPD • MFD • Milwaukee Health Dept • Milwaukee Public Library • DPW Fiber Optic, Signals and Lighting • Port of Milwaukee
Underground Conduit Program • 2010 Budget = $1M new conduit & manhole construction • Existing system: • 560 miles of conduit • 7,500 manholes • 1890’s first communication conduit installed • Expansion & improvements made as part of roadway paving projects when possible to reduce costs