Download
1 / 13
130 likes | 190 Vues
Poverty vs. Passing. By: Melinda Gorneault Period B. Problem.

E N D
Poverty vs. Passing By: Melinda Gorneault Period B
Problem School districts in Connecticut have students with families who are suffering without money. Their parents are either poor, or are on the verge of being poor which gives the students the right to free or reduced lunches. If a school district has a large number of students on free or reduced lunch, then the amount of students passing CAPT decreases.
Hand Drawn Graph • Mean Data Point: (30.69, 45.89) (31,46) • Line of Best Fit crosses (35,45) • Slope= (46-45)/(31-35) = -1/4 • y-y1=m(x-x1) • y-46=-1/4(x-31) • y-46=-1/4x+(31/4) • y=-1/4x+(31/4)+46 • y=-1/4x+(31/4)+(184/4) • y=-1/4x+(215/4) • y=-1/4x+53.75
Making Predictions with Prediction Equation Prediction Equation: y=-1/4x+53.75 Mathenstine High School y=-1/4(72)+53.75 y=-18+53.75 y=35.75 High School High School 97=-1/4x+53.75 1/4x=-43.25 x=-173
Making Predictions with Linear Model Prediction Linear Model Prediction: y=-.6676x+66.382 Mathenstine High School y=-.6676(72)+66.382 y=-48.0672+66.382 y=18.3148 High School High School 97=-.6676x+66.382 .6676x=-30.618 x=-45.863
Conclusions My predictions were not accurate at all for the x-variable because it gave a negative number of students with free/reduced lunches. In both the linear model and the linear regression that my calculator created, the x-variables were negative, but there was a 127.137 difference. The y-variables were closer than the x-variables but still had a difference of 17.4352. If I were to do this project again, I would try to find a larger range of students on free/reduced lunches. In the data, most of the schools didn’t have many students on free/reduced lunch which could have created a flaw line of best fit.
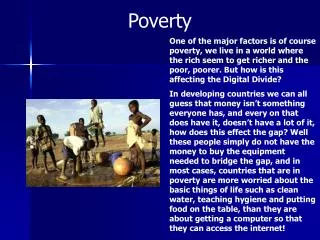
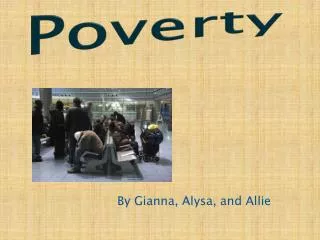
Poverty Throughout doing this project, I realized how many people just in Connecticut suffer from poverty. In all of the schools I collected data for, each one had at least a small percentage of students on free/reduced lunch. I find it really upsetting that some families can’t afford the same things that my family can afford. When families can’t afford health insurance or healthy foods, it affects the children’s ability to do well in school because they probably can’t focus on school. Instead, the students probably focus on their life at home and how they can help support their family.
Source of Data • http://sdeportal.ct.gov/Cedar/WEB/ResearchandReports/SSPReports.aspx