Download
1 / 5
70 likes | 514 Vues
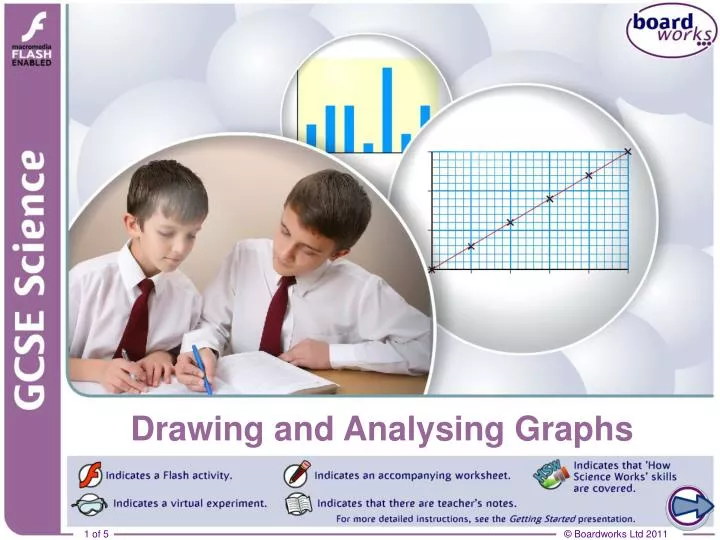
Drawing and Analysing Graphs. Links to the new 2011 specifications. Planning an investigation. As part of your GCSE Science course you will be assessed on your ability to plan, carry out, analyse the results of and evaluate investigations.

E N D
Planning an investigation As part of your GCSE Science course you will be assessed on your ability to plan, carry out, analyse the results of and evaluate investigations. You will be expected to present and analyse results in order to reach a clear conclusion. What should you consider when analysing your results and coming to a conclusion?
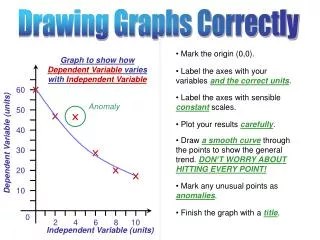
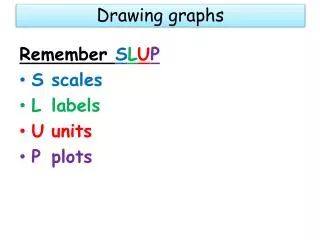
Presenting results: graphs Drawing a graph makes it easier to spot trends and patterns in results. However, it must be neat, clear and easy to interpret. • Label the axes with the names of the independent and dependent variables and any units. • Put the independent variable on the horizontal axis unless you are told otherwise. • Choose scales that let your graph fill the paper. You do not need to start at zero. • Don’t forget to add a title that shows what the graph is about.