Download
1 / 52
740 likes | 1.43k Vues
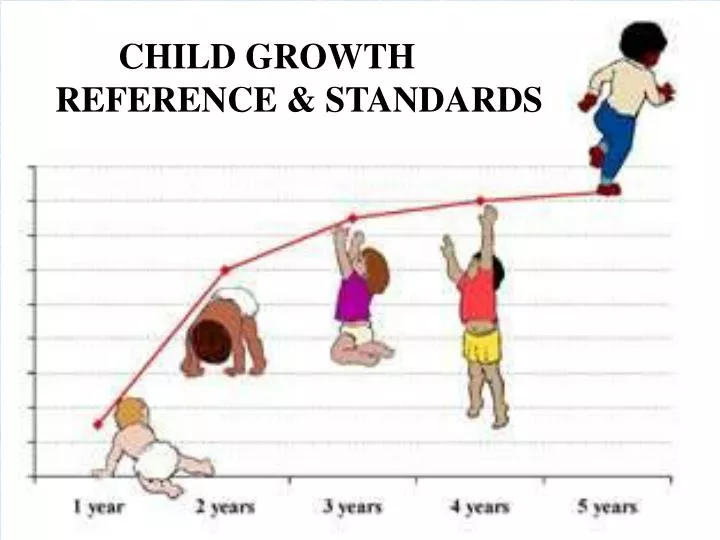
CHILD GROWTH REFERENCE & STANDARDS. FRAMEWORK. What is Growth ?. regular increase in size or weight a continuous process. Child Growth. Growing child is healthy child. Optimal growth occurs only with a adequate food, absence of illness, caring and nurturing, social environment

E N D
What is Growth ? • regular increase in size or weight • a continuous process
Child Growth • Growing child is healthy child. • Optimal growth occurs only with a adequate food, absence of illness, caring and nurturing, social environment • most rapid in first year of life.
How to measure growth ? • Common anthropometric measurements are weight, height, MUAC, head circumference, chest circumference • Most accurate and sensitive method of measuring growth is weight gain • By regularly weighing
What is Growth Monitoring • Regular monthly recording of weight of the children and plotting it on the growth chart which enables us to see the changes in the weight and giving advice to mother about the growth of child Purpose: To take the action against • Inadequate growth in a child • No growth in a child • Weight loss in a child • To restore health & proper growth
Anthropometric Assessment • - Common anthropometric measurements are weight, height, MUAC, head circumference, skinfold thickness (sub-scapular, triceps) • - Indices: for interpretation of measurements. -Weight-for-age - Height-for-age - Weight-for-height -BMI-for-age - MUAC-for-age
Scales of Measurements • Z scores • Percentiles • Percent of median
Z- Score or standard deviation score • The deviation of the value for an individual from the median value of the reference population, divided by the standard Deviation for the reference population • (Observed value) - (Median reference value) • Z- Score = -------------------------------------------------------- • Standard deviation of reference population • A fixed Z score interval implies a fixed height or weight difference for children of a given age . • Advantage:- Allows mean and SD calculation for a group of Z score in population based applications
Percentile : • The rank position of an individual on a given reference distribution, stated in terms of what percentage of the group the individual equals or exceeds . Eg. A child of a given age whose weight falls in the 10th percentile weighs the same or more than 10% of the reference population of children of same age. • Summary statistics not possible • Towards the extremes of the reference distribution there is little change in percentile values, when there is infact substantial change in weight or height. • If the distribution of reference values fallows a normal distribution, percentiles and Z scores are related through a mathematical transformation. • Commonly used -3,-2 and -1 Z scores are respectively the 0.13th , 2.28th and 15.8th percentiles and the 1st ,3rd and 10th percentiles correspond to, respectively, the -2.33,-1.88,and -1.29 Z scores.
Percent of median: • Ratio of a measured value in the individual, for instance weight , to the median value of the reference data for the same age or height, expressed as a percentage. • Main disadvantage- • lack of exact correspondence with a fixed point of • distribution across age and wt status • Eg. Depending on the child’s age, 80% of the median weight for age might be above or below -2Z score; in terms of health, it reflects in different classification of risk. • Cut off points for percent of median are different for the different anthropometric indices.
Various indices and cut-off points for defining malnutrition: __________________________________________________________________________ Indices Indicators Cut-off points for defining for malnutrition malnutrition __________________________________________________________________________ Percentile of ref- % of refer- Z or SD from ref- erence median ence median erence median # Wt-for-ht Wasting < 3rd < 80% < - 2 Ht-for-age Stunting < 3rd < 90% < - 2 Wt-for-age Underweight < 3rd < 80% < -2 __________________________________________________________________________ “Moderate” malnutrition classified as the percent falling between – 2 to – 3 SD and “severe” as the percent falls below – 3 SD from the reference median.
Growth standard or growth reference Dataset representing the distribution of a given anthropometric measurement as it changes with some covariate - usually age - in the two sexes, based on a specified reference sample of children.
REFERENCE OR STANDARD ‘Growth Standard’ • Represents the quality of growth. It represent ‘good’ growth, i.e. a norm to aspire to. • Using a growth standard as a norm implies that it represents optimal growth ‘Reference growth’ • Yardstick to be used for comparison purposes. • It provides a reference, not a norm.
LOCAL OR INTERNATIONAL International standard ( NCHS standard, New WHO Growth standards) • Advantage- Simplifies comparisons between regions or countries • Disadvantage - pattern of growth shown by the standard may be quite inappropriate in particular regions of the world, for example India, where the children are considerably smaller than in the USA. Local standard (ICMR chart, Agrawal KN chart) • More appropriate if clinical decisions are needed • if a statistical analysis is used to adjust anthropometry for age.
DISTANCE AND VELOCITYSTANDARDS Distance standards (Tanner,1962) • Distance standard marked with an extra set of centile-like curves which indicate how much a child’s centile can be expected to change over a given time period. • a one-off measure is used, based on a single measurement, which gives no clues as to the growth pattern that has led the child to its current position. • It indicates only how extreme the child is in terms of current size or status.
DISTANCE AND VELOCITY STANDARDS Velocity standards (Emery et al, 1985) • Velocity standard is a tool to quantify changes in measurement centile over time. • Standards based on growth measured over a period of time • Measures growth rather than status • Require two measurements instead of one • Need to be constructed using longitudinal data. • More sensitive in correctly identifying ill children as it changes more rapidly during growth failure.
MARGINAL AND CONDITIONAL STANDARDS Marginal or unconditional standards • Most common form of standard • Constructed from a reference population where each individual contributes a single measurement, unadjusted for other information. • Expresses individual subjects in terms of a centile relative to the reference population on which the standard is based. • Can be applied equally to distance and velocity - individuals from the reference population provide either a single measurement or a single velocity. • Velocity standards in infancy tend to be unconditional although in practice such infants are followed longitudinally, and often provide several velocity measurements.
MARGINAL AND CONDITIONAL STANDARDS Conditional standards • It works on the principle that a child's measurement should be expressed conditional on, or adjusted for, another covariate in addition to age and sex. • Described for height and height velocity during puberty adjusted for tempo (Tempoconditional or clinical longitudinal standards). • It reduces the variability of the measurement. • Require a strong correlation between the measurement and the conditioning variable. • Conditional predictions for individuals in the tails of the distribution are unbiased, whereas velocity standard predictions are often biased. • The statistical advantage of the conditional standard is that it can be extended naturally to a full regression model with other covariates.
Distance growth chart showing conditional and unconditional standards Age(years)
Velocity growth chart showing conditional and unconditional standards
PURPOSE OF STANDARDS Screening • Anthropometry is widely used as a screening tool for disease in children and adults. • Screening involves identifying individuals below some prespecified cut-off, on the assumption that their chance of being ill is greater than for the population as a whole. • Velocity screening during infancy is valuable for identifying failure to thrive.
PURPOSE OF STANDARDS Clinical • Height velocity is of particular value is the specialist growth clinic. • Conditional standard approach is more appropriate than a velocity Standard in growth clinic. Group summary • Anthropometry is often used to summarize the growth status of groups, with the aim of identifying groups at particular risk of growth faltering. • Use of a growth standard enables distinct age-sex ranges to be combined, which increases the ability to summarize the results. Education • Providing mothers with information about their child’s health through charts such as the ‘Road to health’ chart.
Background & History Galton (1885) - Invented anthropometric percentiles Bowditch (1891) published the first account of growth standards, using curves based on Galton’s percentiles Meredith (1940) at Iowa- Pioneer growth standards Harvard Growth Curves (1960-70) Tanner Growth Curve (1960-70) NCHS/CDC Growth curves (1974) New WHO Growth Charts (1993)
Harvard Growth Curves (1960-70) • In 1966, WHO simplified the Harvard growth curve by introducing the combined sexes version • International growth reference • Reference data from caucasian children in Boston children’s hospital (1930-56) Hospital based Longitudinal study Small sample size Top fed babies • Still served the purpose of creating an awareness and need for monitoring & growth assessment • Used in Indian growth charts & for classification of malnutrition since mid 1970s (50thcentile taken as 100%)
CDC growth charts • NCHS growth charts based on growth of American children developed in 1977 • Adopted by WHO for international use • CDC 2000 growth charts a revised version of earlier NCHS chart: Revision of previous existing 14 charts with introduction of 2 new BMI charts • No new primary data collected • Used national studies conducted at various times & places and improved statistical tools
CDC 2000 growth charts: new features • Addition of BMI for age charts: 2 – 20 years • Addition of 85thcentile on BMI for age & wt for stature charts • Addition of 3rd & 97thcentiles • Limits of length & stature extended on wt for length & wt for stature charts • Smoothened percentile curves & Z scores • Correction of disjunction that occurred between 24 & 36 months when switching from length to stature in NCHS charts
CDC: charts available Birth – 36 months 2 - 20 years 2-5 years • Length & weight for age • Head circumference for age • Weight for length • Stature & weight for age • BMI for age • Weight for stature
New WHO growth standards The international growth standards established by the WHO in April 2006 directly confront the notion that ethnicity is a major factor in how children grow. The new standards demonstrate that children born in different regions of the world , when given an optimum start in life , have the potential to grow and develop within the same range of height and weight for age. (ECHUI 2006 Global Framework for Action)
Rationale for change to new WHO standards NCHS/WHO international reference is inappropriate for assessing nutritional status: • Individual • interferes with sound nutritional management of breastfed • infants, increasing their risk of morbidity and mortality • Populations provides inaccurate estimates of undernutrition and overweight • New WHO standardsCorrects the historical fallacy of using formula fed children from single ethnic group in one country as global standard for assessment of nutritional status of preschool children and consequent problems in interpretation of data .
Why should we adopt new charts? The new Child Growth Standards is a crucial development in improving infant and young child nutrition globally. Unlike the old growth charts, the new standards • describe how children "should grow," • establish breastfeeding as the biological "norm,” • provide international standards for all healthy children, as human milksupports not only healthy growth, but also optimal cognitive development and long-term health.
The WHO Multicentre Growth Reference Study (1997-2003)
WHO Growth Reference StudyPrescriptive Approach • Optimal Nutrition • Breastfed infants • Appropriate complementary feeding • Optimal Environment • No microbiological contamination • No smoking • Optimal Health Care • Immunization • Pediatric routines Optimal Growth
MGRS study design Longitudinal (0-24 months) year 1 year 2 year 3 Cross-sectional (18-71 mo)
MGRS Study Design and Sample Eligibility Criteria for Individuals • No health, environmental or economic constraints on growth • Mother willing to follow feeding recommendations: Exclusive/ predominant breast feeding for 1st 4 mths, introduction of complementary feeding by 6 mths • Term, single birth • Lack of significant perinatal morbidity • Non smoking mothers before and after delivery
MGRS Study Design and Sample Longitudinal study (birth-24 months) • Mothers & newborns screened & enrolled at birth • Weight, length, head circumference: 21 times over 24 months • Arm circumference: 10 times between 3 and 12 months • Skin fold thickness : 6 times between 14 and 24 months
MGRS Study Design and Sample Cross-sectional survey (18-71 mo) Weight, length, head circumference, arm circumference, skin fold thickness Total sample 8440 children from 6 countries • 300 newborns per site (1743 total) followed up till 24 mo from the longitudinal study • 1400 children per site (6647 total) aged 18-71 mo through the cross sectional surveys
Construction of growth curves • The rigorous methods of data collection yielded very high-quality dataset • State-of-art statistical methods applied in a methodical way: • Detailed examination of 30 existing methods, including types of distributions and smoothing techniques; • Selection of a software package flexible enough to allow comparative testing of alternative methods and the actual generation of the curves; • Systematic application of the selected approach to the data to generate models that resulted in the best fit
WHO Child Growth Standards • Attained growth • Weight-for-age • Length/height-for-age • Weight-for-length/height • Body mass index-for-age • Mid-upper arm circumference-for-age • Triceps skinfold-for-age • Subscapularskinfold-for- age • Head circumference-for-age • Growth velocity • Weight • Length/height • Head circumference • Arm circumference
Comparison of existing growth charts WHO Primary data 1997-2003 6 Countries pooled data. healthy breastfed children Birth-5yrs Data charact Source Study period Population Age-group CDC Multiple different studies 1963-1994 US, mixed feeding, no racial/ethnic diff Birth-20 yrs
WHO standards versus NCHS reference • Important differences that vary by age group, sex, growth indicator, specific percentile or z-score curve, and the nutritional status of index populations. • Differences are particularly important during infancy due to type of feeding and issues related to study design (eg, measurement interval) • Difference in shapes of the weight-based curves in early infancy makes interpretation of growth performance strikingly different depending on whether the WHO standard or the NCHS reference is used • Healthy breastfed infants track along the WHO weight-for-age mean z-score while appearing to falter in NCHS from 2 months onwards – implications assessment of lactation performance and adequacy of infant feeding
Mean weight-for-age z-scores of healthy breastfed infants relative to the NCHS, CDC and WHO curves
Prevalence of stunting (below -2 SD length/height-for-age) by age based on the WHO standards and the NCHS reference in Bangladesh
Prevalence of underweight (below -2 SD weight-for-age) by age based on the WHO standards and the NCHS reference in Bangladesh
Growth charts • Consist of a series of percentile curves that illustrate the distribution of selected body measurements in the study population • Used to track the growth of children from infancy thru adolescence • Indicates the state of the child's health, nutrition and well being