Download
1 / 74
760 likes | 1.16k Vues
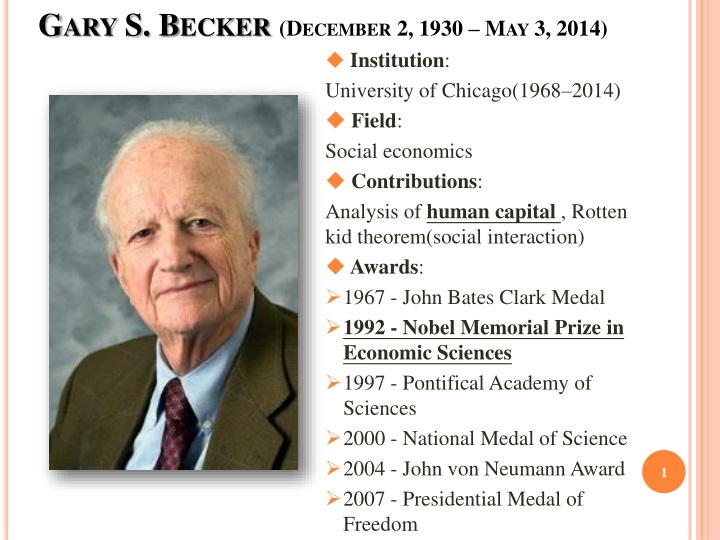
Gary S. Becker ( December 2, 1930 – May 3, 2014). Institution : University of Chicago(1968–2014) Field : Social economics Contributions : Analysis of human capital , Rotten kid theorem(social interaction) Awards : 1967 - John Bates Clark Medal

E N D
Gary S. Becker (December 2, 1930 – May 3, 2014) • Institution: University of Chicago(1968–2014) • Field: Social economics • Contributions: Analysis of human capital , Rotten kid theorem(social interaction) • Awards: • 1967 - John Bates Clark Medal • 1992 - Nobel Memorial Prize in Economic Sciences • 1997 - Pontifical Academy of Sciences • 2000 - National Medal of Science • 2004 - John von Neumann Award • 2007 - Presidential Medal of Freedom
Gary S. Becker - Contributions • Human Capital Individuals make choices of investing in human capital based on rational benefits and cost that include a return on investment as well as a cultural aspect. • Research: • impact of positive and negative habits such as punctuality and alcoholism on human capital. • the different rates of return for different people and the resulting macroeconomic implications. • distinguished between general to specific education and their influence on job-lock and promotions. • Publications:《Human Capital: A Theoretical and Empirical Analysis, with special reference to education 》 • Rotten kid theorem Family members, even if they are selfish, will act to help one another if their financial incentives are properly linked • Publications:《A Treatise on the Family 》
Gary S. Becker - Publications 《Human Capital: A Theoretical and Empirical Analysis , with special reference to education》(1994) 《A Treatise on the Family》(1993)
HUMAN CAPITAL: EDUCATION AND EARNINGS Hwei-Lin Chuang, Ph.D. 2014/04/21
EDUCATION: STYLIZED FACTS • Education is strongly correlated with: • Labor force participation rates • Unemployment rates • Earnings
1. EDUCATION IN THE LABOR MARKET: SOME STYLIZED FACTS 單位:% 表一 勞動參與率與教育程度 表二 就業者與教育程度 單位:%
表三 失業率與教育程度 單位:% 表四 薪資與教育程度
102年大專及以上各項人力指標 表五 薪資與教育程度 • 註:大學及研究所合併為大學及以上。
台灣2000大企業最愛大學生調查 2014年2月 Cheers雜誌 長期作為企業與人才之間的橋梁 ,《Cheers》雜誌16年來執行「3000大企業人才策略與最愛大學生」調查 ﹕ 調查對象﹕ 2013 年《天下》雜誌 2000 大企業人資主管 有效樣本﹕寄出2,102份問卷,回收812份,回收率38.6% 調查期間﹕2013年12月2日~2013年12月27日 調查執行:《天下》雜誌調查中心 、《Cheers》雜誌編輯部
2014 年「企業最愛大學生」調查 : 態度積極主動,是企業用新人最大關鍵 資料來源﹕http://topic.cheers.com.tw/news/20140211_college.pdf 表3:6 成 2 企業敘薪因人而異, 而非看畢業學校 表4: 企業看新人,態度是關鍵
2014 新世代最嚮往100大企業 2014年3月 Cheers雜誌 《Cheers》雜誌2014年新鮮人最嚮往企業調查﹕ 調查對象﹕全台灣148個大學科系應屆畢業生 有效樣本﹕寄出4,885份問卷,回收3,456份 ,回收率70.75% 調查期間﹕2013年12月4日~2014年1月22日 調查方法﹕根據教育部公布101學年度各大專院校的人數與科系分布狀況,採分層比例抽樣法進行郵寄問卷調查 調查執行:《天下》雜誌調查中心 資料來源﹕http://m.cheers.com.tw/article/article.action?id=5056899
王品三連霸!服務業持續升溫、觀光業表現亮眼王品三連霸!服務業持續升溫、觀光業表現亮眼 服務業持續升溫、觀光業表現亮眼 整體觀察,服務業整體名次逐年向前推進,科技業排名反而集體退潮 「鐵飯碗」光環褪色、國營事業排名倒退 台灣中油、台鐵、台灣菸酒、台灣糖業、中華郵政等過去極為搶手的國營事業,今年排名全數大幅倒退,顯示公職退燒趨勢 新鮮人自信不足 近4成的新鮮人面對職場時,擔心自己「能力不足」,其中又以自認缺乏「國際觀與外語能力」的占最多數 以「知名度」和「廣告」來判斷企業好壞、對企業了解不足
Introduction • People bring into the labor market a unique set of abilities and acquired skills known as human capital. • Workers add to their stock of human capital throughout their lives, especially via job experience and education.
Human Capital: Education and Earnings • Wages will vary among workers because workers are different. We each bring into the labor market a unique set of abilities and acquired skills, or human capital. • We begin our study of human capital by focusing on the decision to acquire formal education. The skills we acquire in school make up an increasingly important component of our stock of knowledge.
2. The Schooling Model • What factors motivates some workers to remain in school while other workers dropout before they finish high school? We assume that workers acquire the skill level that maximizes the present value of lifetime earnings.
2. The Schooling Model • Real earnings (earnings adjusted for inflation). • Age-earnings profile: the wage profile over a worker’s lifespan. • The higher the discount rate, the less likely someone will invest in education (since they are less future oriented). • The discount rate depends on: • the market rate of interest. • time preferences: how a person feels about giving up today’s consumption in return for future rewards.
(1) PRESENT VALUE CALCULATIONS • Present value allows comparison of dollar amounts spent and received in different time periods. (An idea from finance.) • Present Value = PV = y/(1+r)t • r is the per-period discount rate. • y is the future value. • t is the number of time periods.
The present value of the earnings stream if the worker only gets a high school education is: (1) The parameter r is the worker’s rate of discount. There are 47 terms in this sum, one for each year that elapses between the ages of 18 and 64.
The present value of the earnings stream if the worker gets a college diploma is: Direct Costs of Attending College Post-College Earnings Stream (2) The first four terms in this sum give the present value of the direct costs of a college education, while the remaining 43 terms give the present value of lifetime earnings in the post-college period.
We assume that a person’s schooling decision maximizes the present value of lifetime earnings. Therefore, the worker attends college if the present value of lifetime earnings when he gets a college education exceeds the present value of lifetime earnings when he gets only a high school diploma, or: Dollars (3) wCOL Goes to College wHS Quits after High School Age 22 65 18 -H FIGURE 1 Earning Streams Faced by a High School Graduate
(2) The Wage-Schooling Locus • The salaries firms are willing to pay workers depends on the level of schooling. • Properties of the wage-schooling locus. • The wage-schooling locus is upward sloping. • The slope of the wage-schooling locus indicates the increase in earnings associated with an additional year of education. • The wage-schooling locus is concave, reflecting diminishing returns to schooling.
Dollars 30,000 25,000 23,000 20,000 Years of Schooling 0 12 13 14 18 (2) The Wage-Schooling Locus The wage-schooling locus gives the salary that a particular worker would earn if he completed a particular level of schooling. If the worker graduates from high school, he earns $20,000 annually. If he goes to college for 1 year, he earns $23,000. And so on.
Defn. The Marginal Rate of Return to Schooling The percentage change in earnings resulting from one more year of school is defined to be the marginal rate of return to schooling.
(3) The Stopping Rule, or When Should I Quit School? Suppose that the worker has a rate of discount r that is constant; that is, it is independent of how much schooling the worker gets. The stopping rule that maximizes the worker’s present value of earnings over the life cycle is given by: Quit school when the marginal rate of return to schooling = r
This stopping rule maximizes the worker’s present value of earnings over the life cycle. Rate of interest r’ r MRR s’ s* Years of Schooling FIGURE 3 The Schooling Decision
Rate of Interest Dollars wHS PBO rAL wDROP PAL rBO MRR Years of Schooling Years of Schooling 12 11 11 12 Schooling and Earnings When Workers Have Different Rates of Discount
Rate of Interest Dollars Z Bob wHS Ace wACE wDROP PACE r MRRBOB MRRACE 11 Years of Schooling 12 Years of Schooling 11 12 Schooling and Earnings When Workers Have Different Abilities Ace and Bob have the same discount rate (r) but each worker faces a different wage-schooling locus. Ace drops out of high school and Bob gets a high school diploma. The wage differential between Bob and Ace (wHS - wDROP) arises both because Bob goes to school for one more year and because Bob is more able. As a result, this wage differential does not tells us by how much Ace’s earnings would increase if he were to complete high school (wACE - wDROP).
3. Is Education a Good Investment? (1) Is Education a Good Investment for Individuals? The rate of return typically estimated for the U.S. generally fall in the range of 5-15 percent. At first glance, an investment in education is about as good as an investment in stocks, bonds, or real estate.
EDUCATION AND THE WAGE GAP • Observed data on earnings and schooling does not allow us to estimate returns to schooling. • In theory, a more able person gets more from an additional year of education. • Ability bias: The extent to which unobserved ability differences exist affects estimates on returns to schooling, since the ability difference may be the true source of the wage differential.
Estimating the Rate of Return to Schooling • A typical empirical study estimates a regression of the form: Log(w) = a·s + other variables • w is the wage rate • s is the years of schooling • a is the coefficient that estimates the rate of return to an additional year of schooling
資料來源:研究所的教育擴張、教育報酬與薪資不均度:臺灣的實證研究(陳文怡、江莉莉)資料來源:研究所的教育擴張、教育報酬與薪資不均度:臺灣的實證研究(陳文怡、江莉莉)
A. The Upward Bias The typical estimates of the rate of return on further schooling overstate the gain an individual student could obtain by investing in education because they are unable to separate the contribution that ability makes to higher earnings from the contribution made by schooling. i.e., Some of the added earnings college graduates typically receive would probably be received by an equally able high school graduates who did not attend college.
Methods to correct this bias: • Separating effects of ability and schooling by including the aptitude-test scores such as IQ. • Controlling for all the unmeasured aspects of ability by using data on twins. Part of earnings differentials associated with higher levels of schooling are due to inherently abler persons obtaining more schooling.
B. The Downward Bias • Some benefits of college attendance are not necessarily reflected in higher productivity. • Most rate-of-return studies fail to include fringe benefits. Fringe benefits, usually as a fraction of total compensation, tend to rise as money earnings rise. • Some of the job-related rewards of college are captured in the form of psychic or nonmonetary benefits.
C. Selection Bias The measured rate of return on a college education may understate the actual return for those who choose to attend college. Likewise, the measured rate of return may overstate the return that would have been received by those terminating schooling with higher school had they instead chosen to attend college.
Measured benefit Bt: : the earnings in a college-level job of those who choose to go to college. : the earning in a high school-level job of those who choose not to go to college. Let : the earnings in a high school-level job of those who choose to attend college terminating schooling at high school. is perhaps less than
:the earnings in a college-level job of those who choose not to attend college were to alter their decisions. is perhaps less than →When abilities are diverse, the principle of comparative advantage is an important factor in making choices about schooling and occupations.
SCHOOL QUALITY AND THE RATE OF RETURN TO SCHOOLING Source: David Card and Alan B. Krueger, “Does School Quality Matter? Returns to Education and the Characteristics of Public Schools in the United States,” Journal of Political Economy 100 (February 1992), Tables 1 and 2. The data in the graphs refer to the rate of return to school and the school quality variables for the cohort of persons born in 1920-1929.
女性商學大學畢業生金融證照持有與初期職涯表現之關係女性商學大學畢業生金融證照持有與初期職涯表現之關係 • 台灣高等教育資料庫「94 學年度大專畢業生問卷調查」與「94 學年度大專畢業後一年問卷調查」資料顯示: 1.私立大學畢業生在金融證照持有的「量」與「種類」上都最多;但在至少持有1 張金融證照的機率上,公立大學畢業生則有顯著較高的機率; (註:畢業一年後的狀態稱為「初期職涯狀態」) 資料來源:女性商學大學畢業生金融證照持有與初期職涯表現之關係(陶宏麟、蕭富方)
女性商學大學畢業生金融證照持有與初期職涯表現之關係女性商學大學畢業生金融證照持有與初期職涯表現之關係 2.商學大學畢業生金融證照持有數量越多,失業機率越低,全職就業機率越高,但並未對應較低的升學機率。以持有的種類看,持有銀行或保險類證照,才對應低失業率與高全職就業率; 3.在對薪資的影響上,金融證照持有的量對薪資無顯著關聯,但若在金融保險業服務則有顯著正向關聯;在持有的種類上,銀行或保險類證照才與金融保險業服務的薪資有顯著正向關聯。 資料來源:女性商學大學畢業生金融證照持有與初期職涯表現之關係(陶宏麟、蕭富方)
女性商學畢業生金融證照與初期職涯表現-樣本結構(一)女性商學畢業生金融證照與初期職涯表現-樣本結構(一) 資料來源:女性商學大學畢業生金融證照持有與初期職涯表現之關係(陶宏麟、蕭富方)
女性商學畢業生金融證照與初期職涯表現-樣本結構(二)女性商學畢業生金融證照與初期職涯表現-樣本結構(二) 資料來源:女性商學大學畢業生金融證照持有與初期職涯表現之關係(陶宏麟、蕭富方)
女性商學畢業生金融證照與初期職涯表現-樣本結構(三)女性商學畢業生金融證照與初期職涯表現-樣本結構(三) 資料來源:女性商學大學畢業生金融證照持有與初期職涯表現之關係(陶宏麟、蕭富方)
女性商學畢業生金融證照與初期職涯表現-樣本結構(四)女性商學畢業生金融證照與初期職涯表現-樣本結構(四) 資料來源:女性商學大學畢業生金融證照持有與初期職涯表現之關係(陶宏麟、蕭富方)
金融證照與初期職涯狀態的關聯(實證I) 資料來源:女性商學大學畢業生金融證照持有與初期職涯表現之關係(陶宏麟、蕭富方)