Download
1 / 5
50 likes | 143 Vues
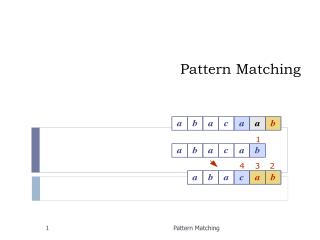
Skills Sharing: How to Log-Log subplot with strings as labels. GLEON Fellowship Workshop January 14-18, 2013 Sunapee, NH Emily Kara Read. Strings as labels. This script is an example of how to pull strings (text) from a cell array to use as a label

E N D
Skills Sharing:How to Log-Log subplot with strings as labels GLEON Fellowship Workshop January 14-18, 2013 Sunapee, NH Emily Kara Read
Strings as labels • This script is an example of how to pull strings (text) from a cell array to use as a label • For example, if you import a .txt file that has text headers, that text will not be recognized as data, but as strings. Those strings can be accessed for functions such as to make a figure label or axis label using the syntax described here
Skill relevance/usefulness • Seems so simple but non-intuitive • Didn’t know how to make labels from array of strings • Learned how to do and wrote a script for reference • Very handy because maximizes automation for scripting functions
Application to data • Used EPA NLA dataset as a example case • Water quality dataset from >1000 lakes all sampled in 2007 • Main challenges • Non-intuitive syntax • Hard to search for examples • Horizontal concatenation • title(labels{i});