Download
1 / 20
200 likes | 307 Vues
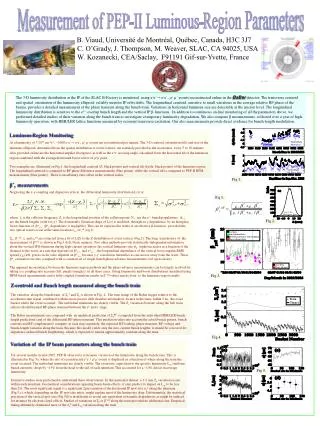
Status of the Bunch length measurement with the luminous region Z distribution. Preliminary results : extraction of both HER and LER bunch length with Simultaneous fit of 2 distribs taken at RF voltage = 3.2 and 3.8 MV Simultaneous fit of 6 distributions taken at different currents

E N D
Status of the Bunch length measurement with the luminous region Z distribution • Preliminary results : • extraction of both HER and LER bunch length with • Simultaneous fit of 2 distribs taken at RF voltage = 3.2 and 3.8 MV • Simultaneous fit of 6 distributions taken at different currents • (I_LER [0.7: 2.4] A; I_HER [1.05: 1.5] A) • HER bunch length assumed constant as I and RF voltage vary • LER bunch length dependence w.r.t I and RF voltage known and • used as a constraint in the fit. • Performed both with the online and offline data • Open questions : • discrepancies between online and offline results • systematics B. VIAUD, C. O’Grady
Measurement with 2 samples taken at RF voltage = 3.2 and 3.8 MV Data type sLERsHERSz2c2 #events (3.2) #events (3.8) online 12.42±0.20 12.05±0.20 299 8.6 0.56M 1.50M offline 14.12±0.15 10.60±0.15 311 11.3 0.53M 3.30M if we subtract the bunch number dependent Z variation offline 13.43±0.15 11.22±0.15 306 11.8 • => Important variation between on- and offline. Why ? • Large correlation between sLER and sHER ( > 99%) • too large to find precisely the individual values ? • MC-TOYs have the same correlation and work correctly. • effect of fitting a PDF which doesn’t describe the data properly ? • need more MC-TOY tests to check that. • several discrepancies observed between on- and offline : • RMS of both RF distributions 0.1 mm larger in offline data • An offset of ~1mm in Z • => Origin ? Different frames ? Something in the slow Z movement subtraction ? • Cuts ? => We’ll try the offline analysis with exactly the cut than online. B. VIAUD, C. O’Grady
Measurement with long coast data Data type sLERsHERSz2c2 #events online 5.6±1.4 14.7±0.6 247 1.5 140k offline 6.4±3.3 14.6±1.6 254 1.2 35k • Not enough stat. + correlations ? B. VIAUD, C. O’Grady
Z variation as a function of the bunch number Slow Z movement not subtracted Slow Z movement subtracted <Z> [mm] B. VIAUD, C. O’Grady Mini-trains ? Bunch number
Z variation as a function of the bunch numberhigh vs. low I High I Low I <Z> [mm] B. VIAUD, C. O’Grady Bunch number
Z-RMS variation as a function of the bunch number Z-RMS [mm] B. VIAUD, C. O’Grady 0 Bunch number 3492
Systematic uncertainties • Varying the parameters fixed in the fit within their • known errors and re-compute the results. • How to evaluate the uncertainty due to the fact the PDF • used in the fit doesn’t describe properly the data ? • try several PDFs (asymmetric bunches) ? • let Beta*_y float ? • use TOYs to produce distorded distributions compared to • the nominal PDF ? • ? B. VIAUD, C. O’Grady
New Offline-Style Analysis Necessary for analyzing MC/data with same code. New (simple) cuts: • ntracks==2 • Chi2(vertex)<3 • Mass(2track)>9.5GeV • E(charged showers)<3GeV • 0.7<tan(lambda1)<2.5 Note that all our units are mm (like PEP). Also, subtract Z motion of beamspot more trivially now (new value every 10 minutes).
Check we see the same effect in data (from late July 2005) • => Similar effect. Similar values of the fitted parameters New Offline Analysis Code c2 ~10 c2 ~3 Z [mm] Z [mm]
Monte Carlo with a gaussian Z distribution • Z-distribution is generated in the mu-pair MC as a gaussian with • <Z>=0 mm and s= 8.5 mm • => No obvious effect due to the • reconstruction / selection c2 ~1.1 Z [mm]
Z vertex resolution from MC • 30um resolution is very small on the scale we are looking, so feels difficult for it to be a resolution effect. Z Reconstructed – Z True (mm)
Z-distribution/bunch length measurement as a function of bunch current • Data/theory discrepancy could be due to Beam-Beam effect proportional to the bunch current • => Compare Z-distribution at high and low current • Used data taken on July the 31st and July the 9th • LER: 2.4 A -> ~ 0.7 A • HER: 1.5 A -> ~1050 A • Selected each time the first and last runs of the period • during which the currents drop.
Standard fit (waists Z-position or b*(y) not allowed to float ) • No obvious difference at this statistics. When waists Z-position or b*(y) are allowed to float : Chi2 ~ 1, fitted values of Zwaist andb*(y) similar to those obtained with the usual sample. 31st of July Low current High current c2 ~1.3 c2 ~1.4 RMS=7.0 mm RMS=7.14 mm Z [mm] Z [mm]
Standard fit (waists Z-position or b*(y) not allowed to float ) • No obvious difference at this statistics. When waists Z-position or b*(y) are allowed to float : Chi2 reduced, fitted values of Zwaist andb*(y) ~ consistent with those we usually see. 9th of July High current Low current Low current High current c2 ~0.8 c2 ~1.6 c2 ~1.3 c2 ~1.4 RMS=7.01 mm RMS=7.2 mm RMS=7.0 mm RMS=7.14 mm Z [mm] Z [mm]
Conclusions • No obvious z-distribution distortion observed when analysis run on monte-carlo • With available statistics, no obvious beam-beam effects in high/low beam-current runs.
How do we proceed? • Analyze monte-carlo with correct hourglass shape (tried once, but hourglass in monte-carlo was not correct we believe). Unlikely cause, IMHO. • Backgrounds (tau, 2-photon)? Unlikely cause, IMHO. • Effect of parasitic crossings (now have bunch number in ntuples … so should be easy). Unlikely cause, IWHO. • Think about asymmetric bunches more • Perhaps help Ilya/Witold study at simulation? • Some machine studies?
Fit the following PDFon the luminous region Z distribution: Reminder I Number of particles per bunch, Zc : Z where the bunchs meet Allowed to float
Reminder II • The theoretical distribution cannot describe the shape of the data. • Trying to understand this before proceeding with bunch length measurement!! s ~ 7.25 mm c2 ~13 Z [mm]
Reminder III • Better data/theory agreement if the waists Z-position or b*(y) are allowed to float in the fit • Waists Z positions / b*(y) values seem unlikely ! • Are they real ? Which other effect could simulate this lack of focalisation ?? c2 ~2.2 c2 ~2.4 Z [mm] Z [mm]