Download
1 / 32
320 likes | 419 Vues
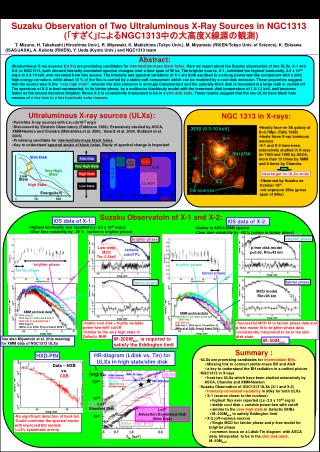
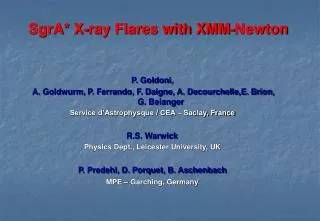
X-ray observation of the Cygnus Loop with Suzaku and XMM-Newton. The X-ray Universe 2008, Granada, Spain 27 - 30 May 2008 Session: E.1+E.2: Planetary Nebulae, SN, SNR, Gamma-ray Bursts and Afterglows Room: Andalucia I

E N D
X-ray observation of the Cygnus Loop with Suzaku and XMM-Newton The X-ray Universe 2008, Granada, Spain 27 - 30 May 2008 Session: E.1+E.2: Planetary Nebulae, SN, SNR, Gamma-ray Bursts and Afterglows Room: Andalucia I Hiroshi Tsunemi1, Satoru Katsuda1,3, Hiroyuki Uchida1, Masaru Kimura1 and Koji Mori2 1Osaka university, Japan 2Miyazaki university, Japan 3NASA GSFC, US
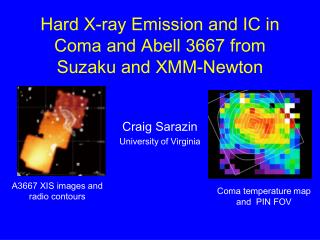
o ~3 N W ROSAT The Cygnus Loop http://wave.xray.mpe.mpg.de/images/rosat/rosat/rosat_cover_569.gif o o - Location: (l, b) = (74 , -8.5 )- Distance: 540 pc, ⇒R=13.2 pc (Blair et al. 2005) - Age: ~1x10⁴ yr,- SN Type: Core-collapse ~26 pc Talk plan Structure ISM abundance Ejecta abundance ROSAT HRI image
CCD observations on the LoopThe structure The cold plasma surrounds the hot plasma ASCA (Miyata et al., 1994, 1999) NE rim and center Chandra (Katsuda et al., 2008) NE rim Newton (Green circles) (Tsunemi et al., 2007, Nemes et al., 2007) NE to SW, South (Uchida et al., 2008) Suzaku (Squares) (Katsuda et al., 2007, Miyata et al., 2007) NE rim, NE to SW North, South and going on
Cygnus Loop We divided the north path and the south path. They are divided into many small sectors: 141 in the north path and 172 in the south path. These small annular sectors contain similar statistics (~20,000 for MOS1/2 and ~40,000 for PN). (Tsunemi et al., 2007)
Center High-T component Low-T component Example spectra Northeastern rim PN PN MOS1, 2 O7 Fe 17 O7 Fe 17 Ne 9 O8 Mg 11 O8 Ne 9 Si 13 Mg 11 L-kTe: 0.17 ± 0.01keVH-kTe: 0.53± 0.02keV kTe: 0.17 ± 0.01keV We applied a 2 kTe-component NEI model for the spectrum in the center portion.
Is Two-kT model really needed? One-kT model vs two-kT model One-kT model vs two-kT model
Center High-T component Low-T component 2 kTe-component model We fitted all the spectra by 2-kTecomponent model.Free parameters:Low-T: kTe, net, NormHigh-T: kTe, net, Norm, abundances Low-T:kTe~ 0.2 keVHigh-T: kTe~ 0.5 keV
High-T Low-T 2 kTe-component model Center High-T component Low-T component We fitted all the spectra by 2-kTecomponent model.Free parameters:Low-T: kTe, net, NormHigh-T: kTe, net, Norm, abundances Low-T:kTe~ 0.2 keVHigh-T: kTe~ 0.5 keV
Temperature distributions of the two components as a function of position. Filled circles show the ejecta component, while crosses show the cavity component. Black show the north path and red shows the south path. ×cavity component ●ejecta component
Cygnus Loop We divided the north path and the south path. They are divided into many small sectors: 141 in the north path and 172 in the south path. These small annular sectors contain similar statistics (~20,000 for MOS1/2 and ~40,000 for PN). (Tsunemi et al., 2007)
Intensity correlation between XMM-Newton and ROSAT XMM total
Intensity correlation between XMM-Newton and ROSAT XMM total = XMM Low-T + XMM High-T
Ejecta exceeds ISM Flux distributions of the two components as a function of position. Filled circles show the ejecta component, while crosses show the cavity component. Black show the north path and red shows the south path. ×cavity component ●ejecta component
Cygnus Loop ROSAT HRI image
Cygnus Loop ROSAT HRI image
CCD observations on the LoopAbundance of the ISM The cold plasma is metal deficient very much. ASCA (Miyata et al., 1994, 1999) NE rim and center Chandra (Katsuda et al., 2008) NE rim Newton (Green circles) (Tsunemi et al., 2007, Nemes et al., 2007) NE to SW, South (Uchida et al., 2008) Suzaku (Squares) (Katsuda et al., 2007, Miyata et al., 2007) NE rim, NE to SW North, South and going on
Spatially Resolved Spectral Analysis for NE-rim Regions Non-Equilibrium Ionization (NEI) model. => Single component model can represent the data very well. kTe : ~ 0.25 keV , t : ~1x1011cm-3 sec
Metal-abundances @ NE-rim Metal abundance(relative to the solar values) C/H: ~0.27 N/H: ~0.10O/H: ~0.11Ne/H: ~0.21Mg/H: ~0.17Si/H: ~0.34S/H: ~0.16Fe/H: ~0.20 All are sub-solar ⇒ ISM origin rather than ejecta origin Optical data in the direction of the Cygnus Loop shows sub-solar (O/H ~ 0.4).
Is ISM around the Cygnus Loop metal poor? Model fitting shows the metal deficient C~0.27、N~0.1、O~0.1 (Katsuda et al., 2007) Optical data in the direction of the Loop indicates the metal poor (O~0.4) (Cartledge et al., 2004) Non-thermal component may reduce the apparent metal abundance. Fit is not improved by adding a simple power law component. Some area in the NE rim shows normal metal abundance (O=0.5). This may show a pure ISM component. (Katsuda et al., 2007) ⇒It may really metal deficient; less than that of the ISM there. ⇒Model is too simple. 1897/1208
Thin thermal with ISM abundance + Power spectrum ? Γ= 1 Γ= 2 2018/1208 2017/1208 Γ= 4 Γ= 3 2032/1208 1998/1208
CCD observations on the Loop ASCA (Miyata et al., 1994, 1999) NE rim and center Chandra (Katsuda et al., 2008) NE rim Newton (Green circles) (Tsunemi et al., 2007, Nemes et al., 2007) NE to SW, South (Uchida et al., 2008) Suzaku (Squares) (Katsuda et al., 2007, Miyata et al., 2007) NE rim, NE to SW North, South and going on
Abundance maps O N Ne C Mean: ~0.21Mass: ~2x10⁻³ Mean: ~0.11Mass: ~6x10⁻³ Mean: ~0.27Mass: ~5x10⁻³ Mean: ~0.10Mass: ~7x10⁻⁴ S Fe Si Mg Mean: ~0.17Mass: ~2x10⁻³ Mean: ~0.17Mass: ~7x10⁻⁴ Mean: ~0.34Mass: ~2x10⁻³ Mean: ~0.16Mass: ~4x10⁻⁴ Small region in the NE rim shows higher abundance than the surrounding area. Suzaku and Chandra
NE rim in the Loop has two kinds of plasma : normal abundance plasma and metal deficient plasmaKatsuda et al., 2007 Normal metal abundance (O~0.5) Metal poor abundance (O ~0.1)
CCD observations on the LoopAbundance of the ejecta The hot plasma is directly seen where there is no cold plasma. ASCA (Miyata et al., 1994, 1999) NE rim and center Chandra (Katsuda et al., 2008) NE rim Newton (Green circles) (Tsunemi et al., 2007, Nemes et al., 2007) NE to SW, South (Uchida et al., 2008) Suzaku (Squares) (Katsuda et al., 2007, Miyata et al., 2007) NE rim, NE to SW North, South and going on
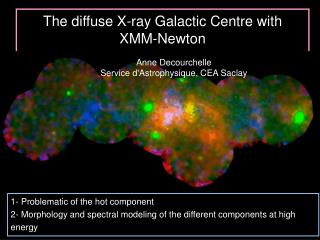
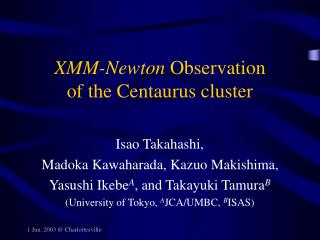
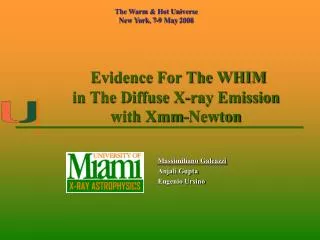
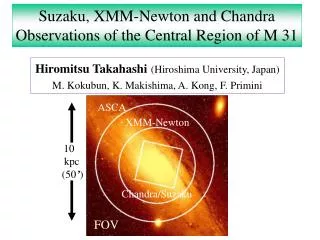
Suzaku Suzaku Suzaku Observations http://www.astro.isas.ac.jp/astroe/gallery/astroe_1_med.jpg Suzaku image (0.2-3 keV) Obs. date:23/11/2005 ~ 25/05/2006 Suzaku FOV overlaid on the ROSAT HRI image Total exposure time: ~186 ksec
Asymmetric Distributions of Metal rich ejecta Mg ~3 O ~5 Ne ~3 S ~20 Fe ~15 Si ~10
Summary • The Cygnus Loop show double structures; swept-up cavity material and metal rich ejecta. • Low-T component (cavity wall matter) • Low-kT component surrounds the Loop with various thickness. The abundance is metal deficient. This may be due to the non-thermal component usually seen in the young SNR. • Major part of the Loop is surrounded by a cavity wall material. The south blow-up region clearly shows very thin wall. There is also a very thin wall in the central part of the Loop. This must be a blow-up region either in the near side or in the far side. • A various type of plasma condition is seen in the cavity wall plasma. • High-T component (fossil material of explosion ejecta) • High kT component shows high metal abundance. The spreads of Ne, Mg, Si, S and Fe are considered to represent the onion-skin structure at the time of SN explosion, suggesting significant convection has not occurred yet. • Comparing the relative abundances obtained from our data with those from theoretical calculation for type-II SN, the mass of the progenitor star is likely to be ~15M◎. • High T component extends to the south (X-ray data did not show the second SNR) . It also extends to the outer side in the middle of the Loop.