Download
1 / 36
440 likes | 953 Vues
The Flow of Energy: Primary Production. What we need to learn : What is primary production , and how is it measured? How are primary and ecosystem productivity related? How are production , standing crop , and turnover rate related?

E N D
The Flow of Energy: Primary Production What we need to learn: • What is primary production, and how is it measured? • How are primary and ecosystemproductivity related? • How are production,standing crop, and turnoverraterelated? • What limits primary production and how does it vary in the world’s ecosystems?
The Process of Primary Production • Production is the creation of new organic matter • Primary production is production of new organic matter by autotrophs • Over time, primary production results in the addition of new plant biomass to the system
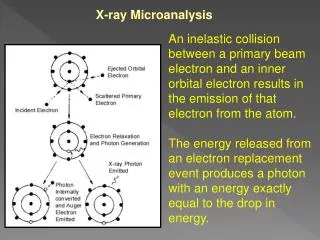
Photosynthesis Requires Light Energy On Land, net efficiency ~ 0.01 - 3% In Water, net efficiency ~ 0.01 - 1% Produces O2 Requires CO2 (See primer on photosynthesis)
Definitions * Gross Primary Production = GPP GPP = All CO2 fixed by the plant in photosynthesis. * Respiration = R R = CO2 lost from metabolic activity Rp = Respiration by Plants Rh = Respiration by Heterotrophs Rd = Respiration by Decomposers *Net Primary Production = NPP NPP =GPP-Rp * Net Ecosystem Production = NEP NEP = GPP - (Rp + Rh + Rd)
Measuring Primary Production 1. Measure the rate of photosynthesis CO2 + H2O ===> C6H12O6 + O2 • a). measure the CO2 used (e.g., using 14C-CO2) • b). measure the O2 produced • estimates GPP (Gross Primary Production, total energy “fixed”) 2. Measure the rate of formation ofnew plant matter • final plant biomass minus initial • estimates NPP (Net Primary Production = total energy fixed - metabolic costs, herbivory, etc.) • Respiration is the reverse process: C6H12O6 + O2 ===> CO2 + H2O
Light-Dark Bottle Method 1. Fill all bottles with sample water. 2. Measure initial O2 , incubate samples in the light. 1 hour Incubation in LIGHT algae Dark Bottle Initial Bottle Light Bottle 3. Measure final O2 in light and dark bottles.
Initial Bottle = 8 mg O2/L = GPP & Resp = 10 mg O2/L Light Bottle = Resp = 5 mg O2/L Dark Bottle (Light - Initial) = (10-8) = 2 mg/L/hr = GPP-R= NPP (Initial - Dark) = (8-5) = 3 mg/L/hr = Respiration, R (Light - Dark) = (10-5) = 5 mg/L/hr = NPP+Resp = GPP (or, GPP-R+R =GPP)
September 1997-2001 integrated Global distribution of algal biomass December 1997-2002 integrated SeaWiFS derived NDVI http://oceancolor.gsfc.nasa.gov
Production, Standing Crop, Turnover • Production - reported as the formation rate of new organic matter, per unit area earth, per unit of time: • calories / m2 / year (energy) • grams / m2 / year (organic matter) • Standing crop - the amount of organic matter in a given area at a specific time • cal / m2 (energy) • g / m2 (organic matter) • In managing a forest, should we be more interested in the forest’s production, or its standing crop? What variable must we consider?
Time! = • Standing crop Production • (g / m2) (g/m2/year) • Stock Rate = 1 / (1/year) = year = Measure of time: (Residence Time or Turnover Time)
Take-Home Message #1: “Time affects everything – always consider time.”
Primary Production of the World’s Ecosystems • World ecosystems vary widely in productivity. • The most productive systems(by unit area) are estuaries, swamps and marshes, tropical rain forests, and temperate rain forests. • In terms of global NPP, the most productive systems are open oceans, tropical rain forests, savannas, and tropical seasonal forests.
What Determines Ecosystem Productivity? • Climate and nutrients determine ecosystem productivity. • In general, NPP increases with precipitation and temperature. • Areas low in nutrients, such as the open ocean, have low NPP per unit area.
For any given temperature or precipitation there is a large spread of production values – Why? NUTRIENTS!
Summary (so far…) • Primary production is the creation of new organic matter by autotrophs, and can be quantified by measuring the rate of the photosynthetic reaction. • GPP is the total organic matter synthesized. NPP < GPP due to metabolic costs of autotrophs. • Production varies among ecosystems due to climate and nutrient availability.
The Flow of Energy: Higher Trophic Levels We wish to know: • With what efficiency is energy converted between trophic levels? • What is assimilation efficiency, net production efficiency, and ecological efficiency? • What are pyramids of numbers, biomass, and energy? • How much energy is available to humans, and how much do we use?
Energy Transfers to Higher Trophic Levels What happens to NPP? On average, it is consumed. Some is stored in sediments (coal, oil). Energy is released in this consumption, and metabolic work is done as cellular respiration converts energy stored in chemical bonds into heat. This energy is lost for the next trophic level.
Principles of Energy Flow As energy passes from trophic level to trophic level: • Only a fraction of the energy available to one trophic level is transferred to the next trophic level. The rule of thumb is ~10%, but this can vary from 1 - 15%. • Typically the numbers and biomass of organisms decreases as one ascends the food chain. This is called a “pyramid”.
1. “Assimilation Efficiency”= (Assimilation / Ingestion) Assimilation = (Ingestion) – (Excretion) Assimilation Efficiency = 15 – 50 % for plant food = 60 – 90 % for animal food
2. “Net Production Efficiency”= (Production / Assimilation) • Production= (Growth + Reproduction) • For plants, net production efficiency • = (NPP / GPP) = 30-85% • For invertebrates = 20% on average • For vertebrates = 2% on average WHY ?
Why is the net production efficiency so low for vertebrates (only 2%)? (a) Vertebrates are on average much larger than invertebrates, and as mass increases energy efficiency decreases. (b) Vertebrates are homeotherms (maintain a constant body temperature)and invertebrates and plants are cold-blooded, meaning that the metabolism costs for vertebrates are much higher. (c) Invertebrates (and plants) are typically sedentary, and the extra movement of vertebrates to find food (prey) costs energy.
3. “Ecological Efficiency” = consumer production / prey production For example, = Fox production/Rabbit production = [(10 kg/yr)/ (100 kg/yr) ] * 100 = 10 % * Ecological efficiency ranges from ~1 to 15 % * This sets the absolute number of trophic levels in a food web
Pyramids of Numbers, Biomass, and Energy • Because energy is “used up” by the metabolic activities of organisms, the amount of energy available to the next trophic level (e.g., foxes) is less than the amount that entered the trophic level below (e.g., hares). • In general, this lower amount of energy available leads to a decrease in standing crop biomass or numbers of organisms as one proceeds to higher trophic levels.
Pyramids complications and exceptions • Complications: pyramids of numbers might be shallowif the predators are much larger than their prey, - or -, they might be inverted if, e.g., large plants have numerous insect grazers. • Exceptions: pyramids of biomass might be inverted if a lower trophic level has a much higher turnover rate than a higher trophic level. • Pyramids of energy can never be inverted.
Residence Time of Energy • RT = ( energy in biomass/ net productivity )
World NPP & Human Consumption • World NPP is ~ 224.5 Pg/yr of organic matter. 1 petagram, Pg = 1015 g = 109 metric tonnes (1 metric tonne = 1,000 kg) • Terrestrial NPP > Aquatic NPP(despite oceans covering 70% of earth’s surface)
World NPP & Human Consumption • Estimate 1 = 40.2 Pg (30.7%) annually (direct and co-opted use as food, fiber, fuel, timber) • Estimate 2 = 58.1 Pg (39%) annually (direct use, co-opted NPP, and “forgone” NPP) “Forgone” = converting forest to pasture, desertification, loss to settlement
Implications of Human Co-option of NPP: • Human use of marine productivity is small • On land, 1 species commands almost 40% of NPP • Consequences include environmental degradation, species extinctions, altered climate • What is the human carrying capacity of the planet? What is Sustainable? Being Alive - vs.- Having a life
Take-Home Message #2: “Ecological efficiency will get us in the end.”
The Human Use of Global Production SourceNPP used & co-opted (Pg) Cultivated land 15.0 Grazing Land 11.6 Forest land 13.6 Human-occupied areas 0.4 Sub-total terrestrial40.6 Fisheries 2.0 Total 42.6 % terrestrial NPP co-opted (40.6/132.1) 30.7 %
The High Calculation SourceAmount (Pg) Previous terrestrial total 40.6 Decreased NPP in agriculture 9.0 Conversion forest to pasture 1.4 Desertification 4.5 Loss to settlement 2.6 Sub-total terrestrial 58.1 % Terrestrial co-opted (58.1/149.8) 38.8 % % Total NPP co-opted (60.1/224.5) 24.8 %