Download

1 / 81
830 likes | 1.04k Vues
Management Overview. 9861 Broken Land Parkway Fourth Floor Columbia, Maryland 21046 800-638-6316 www.mccabe.com support@mccabe.com 1-800-634-0150. Agenda. McCabe IQ Overview Software Measurement Issues McCabe Concepts Software Quality Metrics Software Testing Questions and Answers.

E N D
ManagementOverview 9861 Broken Land Parkway Fourth Floor Columbia, Maryland 21046 800-638-6316 www.mccabe.com support@mccabe.com 1-800-634-0150
Agenda • McCabe IQ Overview • Software Measurement Issues • McCabe Concepts • Software Quality Metrics • Software Testing • Questions and Answers
About McCabe & Associates Global Presence 20 Years of Expertise Analyzed Over 25 Billion Lines of Code
McCabe IQ process flow Target platform Analysis platform QualityManagement Source code Instrumented source code McCabe IQ Compile and run EffectiveTesting Execution log
McCabe IQ and Configuration Management QualityManagement • Merant PVCS • Rational ClearCase • CA Endevor EffectiveTesting McCabe IQ TestEnvironment ExecutionLog • Monitor quality as software changes • Manage test environment
McCabe IQ and Test Automation RiskManagement TestManagement • Mercury Interactive: • TestDirector • WinRunner McCabe IQ Source code GUI TestAutomation EffectiveTesting Test executable Execution log Non-GUI TestAutomation • Risk-driven test management • Effective, automated testing
QUALITY ASSURANCE TESTING McCabe Test McCabe TestCompressMcCabe SliceMcCabe ReTest McCabe QA McCabe DataMcCabe CompareMcCabe Change McCabe IQ Framework (metrics, data, visualization, testing, API) Source Code Parsing Technology (C, C++, Java, Visual Basic, COBOL, Fortran, Ada) McCabe IQ Components
McCabe QA McCabe QA measures software quality with industry-standard metrics • Manage technical risk factors as software is developed and changed • Improve software quality using detailed reports and visualization • Shorten the timebetween releases • Develop contingency plans to address unavoidable risks
McCabe Data McCabe Data pinpoints the impact of data variable modifications • Identify usage of key data elements and data types • Relate data variable changes to impacted logic • Focus testing resources on the usage of selected data
McCabe Compare McCabe Compare identifies reusable and redundant code • Simplify maintenance and re-engineering of applications through the consolidation of similar code modules • Search for software defects in similar code modules, to make sure they’re fixed consistently throughout the software
McCabe Change McCabe Change identifies new and changed modules • Manage change with more precision than the file-level information from CM tools • Work with a complete technical risk profile • Complex? • Poorly tested? • New or changed? • Focus review and test efforts
McCabe Test McCabe test maximizes testing effectiveness • Focus testing on high-risk areas • Objectively measure testing effectiveness • Increase the failure detection rate during internal testing • Assess the time and resources needed to ensure a well-tested application • Know when to stop testing
McCabe Slice McCabe Slice traces functionality to implementation • Identifies code that implements specific functional transactions • Isolates code that is unique to the implementation of specific functional transactions • Helps extract business rules for application redesign
McCabe IQ Components Summary • McCabe QA: Improve quality with metrics • McCabe Data: Analyze data impact • McCabe Compare: Eliminate duplicate code • McCabe Change: Focus on changed software • McCabe Test: Increase test effectiveness • McCabe TestCompress: Increase test efficiency • McCabe Slice: Trace functionality to code • McCabe ReTest: Automate regression testing
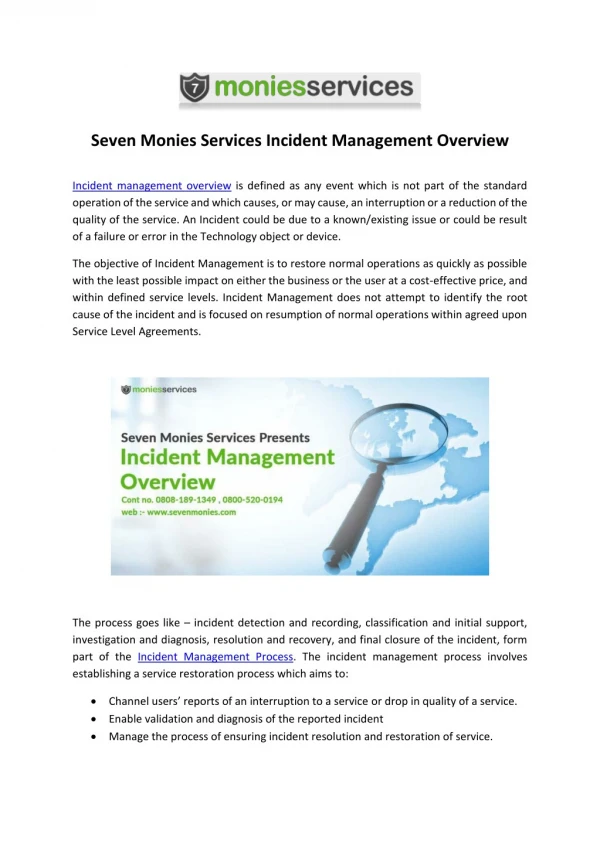
Software Measurement Issues • Risk management • Software metrics • Complexity metrics • Complexity metric evaluation • Benefits of complexity measurement
Software Risk Management • Software risk falls into two major categories • Non-technical risk: how important is the system? • Usually known early • Technical risk: how likely is the system to fail? • Often known too late • Complexity analysis quantifies technical risk • Helps quantify reliability and maintainability • This helps with prioritization, resource allocation, contingency planning, etc. • Guides testing • Focuses effort to mitigate greatest risks • Helps deploy testing resources efficiently
Software Metrics Overview • Metrics are quantitative measures • Operational: cost, failure rate, change effort, … • Intrinsic: size, complexity, … • Most operational metrics are known too late • Cost, failure rate are only known after deployment • So, they aren’t suitable for risk management • Complexity metrics are available immediately • Complexity is calculated from source code • Complexity predicts operational metrics • Complexity correlates with defects, maintenance costs, ...
Complexity Metric Evaluation • Good complexity metrics have three properties • Descriptive: objectively measure something • Predictive: correlate with something interesting • Prescriptive: guide risk reduction • Consider lines of code • Descriptive: yes, measures software size • Predictive, Prescriptive: no • Consider cyclomatic complexity • Descriptive: yes, measures decision logic • Predictive: yes, predicts errors and maintenance • Prescriptive: yes, guides testing and improvement
Benefits of Complexity Measurement • Complexity metrics are available from code • They can even be estimated from a design • They provide continuous feedback • They can identify high-risk software as soon as it is written or changed • They pinpoint areas of potential instability • They can focus resources for reviews, testing, and code improvement • They help predict eventual operational metrics • Systems with similar complexity metric profiles tend to have similar test effort, cost, error frequency, ...
McCabe Concepts Definition: In C and C++, a module is a function or subroutine with a single entry point and a single exit point. A module is represented by a rectangular box on the Battlemap. main Difficult to maintainable module function a function c Difficult to test module printf function d Library module Well-designed, testable module
Analyzing a Module For each module, an annotated source listing and flowgraph is generated. Flowgraph - an architectural diagram of a software module’s logic. Battlemap main b c printf Stmt Code Number main Flowgraph node:statement or block of sequential statements 1 main() 2 { 3 printf(“example”); 4 if (y > 10) 5 b(); 6 else 7 c(); 8 printf(“end”); 9 } 1-3 condition 4 5 7 end of condition edge: flow of control between nodes 8-9
Flowgraph Notation (C) if (i || j) ; if (i) ; else ; if (i) ; if (i && j) ; do ; while (i); while (i) ; switch(i) { case 0: break; ... }
Flowgraph and Its Annotated Source Listing Origin information Metric information 0 Decision construct 1* 2 3 6* 4* 7 5 8 9 Node correspondence
Low Complexity Software • Reliable • Simple logic • Low cyclomatic complexity • Not error-prone • Easy to test • Maintainable • Good structure • Low essential complexity • Easy to understand • Easy to modify
Moderately Complex Software • Unreliable • Complicated logic • High cyclomatic complexity • Error-prone • Hard to test • Maintainable • Can be understood • Can be modified • Can be improved
Highly Complex Software • Unreliable • Error prone • Very hard to test • Unmaintainable • Poor structure • High essential complexity • Hard to understand • Hard to modify • Hard to improve
Would you buy a used car from this software? • Problem: There are sizeand complexity boundariesbeyond which softwarebecomes hopeless • Too error-prone to use • Too complex to fix • Too large to redevelop • Solution: Control complexityduring development andmaintenance • Stay away from the boundary
Important Complexity Measures • Cyclomatic complexity: v(G) • Amount of decision logic • Essential complexity: ev(G) • Amount of poorly-structured logic • Module design complexity: iv(G) • Amount of logic involved with subroutine calls • Data complexity: sdv • Amount of logic involved with selected data references
Cyclomatic Complexity • The most famous complexity metric • Measures amount of decision logic • Identifies unreliable software, hard-to-test software • Related test thoroughness metric, actual complexity, measures testing progress
Cyclomatic complexity, v - A measure of the decision logic of a software module. Applies to decision logic embedded within written code. Is derived from predicates in decision logic. Is calculated for each module in the Battlemap. Grows from 1 to high, finite number based on the amount of decision logic. Is correlated to software quality and testing quantity; units with higher v, v>10, are less reliable and require high levels of testing. Cyclomatic Complexity
Cyclomatic Complexity 1 5 4 =2 2 R1 3 R2 edges and node method e = 24, n = 15 v = 24 -15 +2 v = 11 6 7 =1 =1 R3 R4 9 8 10 R5 11 =1 predicate method v = + 1 v = 11 12 R11 13 17 =2 14 16 15 R7 region method regions = 11 Beware of crossing lines R6 19 18 =1 =1 R8 R9 21 20 22 R10 23 23 =1 24 1 2 4 3 5 6 7 8 9 10 11 12 13 14 15
Higher risk of failures • Difficult to understand • Unpredictable expected results • Complicated test environments including more test drivers • Knowledge transfer constraints to new staff 20 15 10 5 Vital Signs and High v’s Risks of increasing v TIME
Essential Complexity • Measures amount of poorly-structured logic • Remove all well-structured logic, take cyclomatic complexity of what’s left • Identifies unmaintainable software • Pathological complexity metric is similar • Identifies extremely unmaintainable software
Essential complexity, ev - A measure of “structuredness” of decision logic of a software module. Applies to decision logic embedded within written code. Is calculated for each module in the Battlemap. Grows from 1 to v based on the amount of “unstructured” decision logic. Is associated with the ability to modularize complex modules. If ev increases, then the coder is not using structured programming constructs. Essential Complexity
Essential Complexity - Unstructured Logic Branching out of a loop Branching in to a loop Branching into a decision Branching out of a decision
Essential complexity, ev, is calculated by reducing the module flowgraph. Reduction is completed by removing decisions that conform to single-entry, single-exit constructs. Essential Complexity = 1 Cyclomatic Complexity = 4 Essential Complexity - Flowgraph Reduction
Essential Complexity Flowgraph and reduced flowgraph after structured constructs have been removed, revealing decisions that are unstructured. Reduced flowgraph v = 3 Therefore ev of the original flowgraph = 3 Superimposed essential flowgraph v = 5
Essential Complexity Essential complexity helps detect unstructured code. v = 10 ev = 1 Good designs v = 11 ev = 10 Can quickly deteriorate!
Intricate logic • Conflicting decisions • Unrealizable test paths • Constraints for architectural improvement • Difficult knowledge transfer to new staff 10 6 3 1 Vital Signs and High ev’s Risks of increasing ev TIME
Decreasing and managing v and ev 20 15 • Emphasis on design architecture and methodology • Development and coding standards • QA procedures and reviews • Peer evaluations • Automated tools • Application portfolio management • Modularization 10 1 How to Manage and Reduce v and ev TIME
Module Design Complexity How Much Supervising Is Done?
Module design complexity • Measures amount of decision logic involved with subroutine calls • Identifies “managerial” modules • Indicates design reliability, integration testability • Related test thoroughness metric, tested design complexity, measures integration testing progress
Module design complexity, iv - A measure of the decision logic that controls calls to subroutines. Applies to decision logic embedded within written code. Is derived from predicates in decision logic associated with calls. Is calculated for each module in the Battlemap. Grows from 1 to v based on the complexity of calling subroutines. Is related to the degree of "integratedness" between a calling module and its called modules. Module Design Complexity
Module Design Complexity Module design complexity, iv, is calculated by reducing the module flowgraph. Reduction is completed by removing decisions and nodes that do not impact the calling control over a module’s immediate subordinates.
Module Design Complexity Example: main iv = 3 main() { if (a == b) progd(); if (m == n) proge(); switch(expression) { case value_1: statement1; break; case value_2: statement2; break; case value_3: statement3; } } progd proge main Reduced Flowgraph v = 5 v = 3 progd() progd() proge() proge() do not impact calls Therefore, iv of the original flowgraph = 3
Data complexity • Actually, a family of metrics • Global data complexity (global and parameter), specified data complexity, date complexity • Measures amount of decision logic involved with selected data references • Indicates data impact, data testability • Related test thoroughness metric, tested data complexity, measures data testing progress
Data complexity calculation M : M : 1 1 2 2 3 C1 C1 3 4* 4* => Data A 5 Data A 6 C3 7 8 9 9 C2 C2 10 C4 11 C5 Paths Conditions Pb : 1-2-3-4-9-3-4-9-12 C1 = T, C2 = T, C2 = F P2 : 1-2-12 C1 = F P3 : 1-2-3-4-9-12 C1 = T, C2 = F 12 12 v = 6 data complexity = 3
v, number of unit test paths for a module iv, number of integration tests for a module Total number of test paths for all modules Average number of testpaths for each module Module Metrics Report
Common Testing Challenges • Deriving Tests • Creating a “Good” Set of Tests • Verifying Tests • Verifying that Enough Testing was Performed • Providing Evidence that Testing was Good Enough • When to Stop Testing • Prioritizing Tests • Ensuring that Critical or Modified Code is Tested First • Reducing Test Duplication • Identifying Similar Tests That Add Little Value & Removing Them
Test Scenarios An Improved Testing Process Black Box White Box Static Identification of Test Paths Requirements Implementation Analysis Sub-System or System