Download
1 / 61
610 likes | 738 Vues
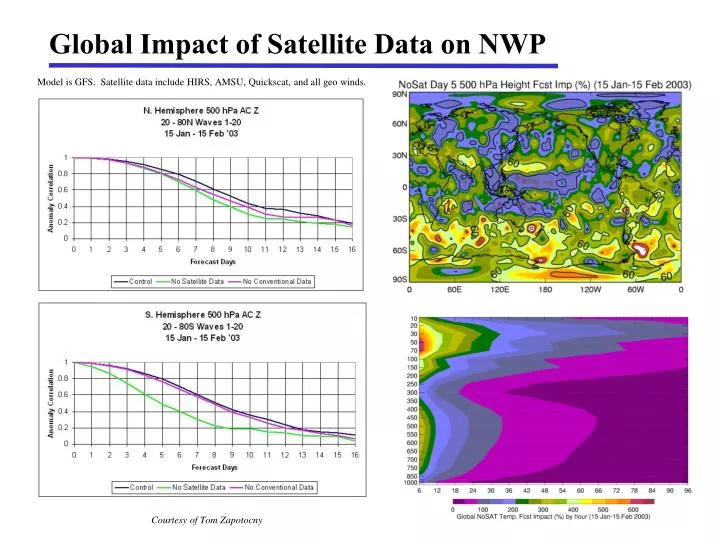
Global Impact of Satellite Data on NWP. Model is GFS. Satellite data include HIRS, AMSU, Quickscat, and all geo winds. Courtesy of Tom Zapotocny. Current Users :

E N D
Global Impact of Satellite Data on NWP Model is GFS. Satellite data include HIRS, AMSU, Quickscat, and all geo winds. Courtesy of Tom Zapotocny
Current Users: • European Centre for Medium-Range Weather Forecasts (ECMWF; Lueder von Bremen and Jean-Noel Thepaut) - Using winds in operational system. • NASA Global Modeling and Assimilation Office (GMAO; Lars Peter Riishojgaard and Yanqiu Zhu) - Using winds in operational system. • Japan Meteorological Agency (JMA; Masahiro Kazumori) – Using winds in operational system (Arctic only) • Canadian Meteorological Centre (CMC; Real Sarrazin) – Using winds in operational system. • US Navy, Fleet Numerical Meteorology and Oceanography Center (FNMOC; Pat Pauley and Chuck Skupniewicz) – Using winds in operational system. • UK Met Office (Mary Forsythe and Howard Berger) – Using winds in operational system. • National Centers for Environmental Prediction NCEP/EMC; John LeMarshall, Jim Jung, Tom Zapotocny) - Engaged in impact studies. Plan to go operational in June 2005. • Deutscher Wetterdienst (DWD; Alexander Cress) – Using winds in experimental system • NCAR Antarctic Mesoscale Model (AMPS; Dale Barker) – Beginning to test the winds over Antarctica. • Other (incomplete information): Chinese meteorological agency, one or more countries involved in HIRLAM. • Potential Users: • Forecast offices: NWS Alaska (Gary Hufford); McMurdo – Not using them yet, but will. • ECMWF Reanalysis (Fedor Mesinger) – Would also use historical AVHRR winds if available. MODIS Winds in NWP
NASA Global Modeling and Assimilation Office (GMAO)(Lars Peter Riishojgaard and Yanqiu Zhu) • MOWSAP (MODIS Winds Special Acquisition Period): November 8, 2003-January 31, 2004 • Winds generated by CIMSS and by NESDIS (pre-operational mode) • Different code bases • Different backgrounds for QC and height assignment • Winds generated from MODIS Aqua and MODIS Terra imagery • Assimilation experiments by GMAO, ECMWF, Met Office, CMC • Standard common diagnostics • GMAO experiments: 5-day forecast every other day; 42 members in the ensemble
Forecast skills verified against their own analyses (CIMSS winds) (NESDIS winds) Forecast scores are the correlation between the forecast geopotential height anomalies, with and without the MODIS winds, and their own analyses.
Forecast skills verified against NCEP analysis (CIMSS winds) (NESDIS winds)
Forecast skills verified against NCEP analysis (CIMSS winds) (NESDIS winds)
Forecast Busts (GMAO) Southern Hemisphere Extratropics Arctic Blue is forecast with MODIS winds; red is control run
Summary of GMAO Results • MODIS winds complement other observations in the high latitudes; more so in the SH than in the NH due to the current data sparsity • Consistency of data delivery is acceptable; timeliness remains problematic; being addressed using DB capability • Based on independent verification and innovation statistics, the quality of the information is acceptable • Positive overall contribution to forecast skill; substantial in the SH
European Centre for Medium-Range Weather Forecasts (ECMWF) (Lueder von Bremen and Jean-Noel Thepaut) Assimilation experiments - 3DVAR, T159/159: 5 March—3 April 2001 - 4DVAR, T511/159, compared to ops: 13 July—16 August 2002… - 4DVAR, T511/159: 5—15 March 2002… Use same assimilation settings as for geostationary AMVs, except for blacklisting of lower level winds: Winds used: IR, WV cloudy and clear Over land: IR and WV winds above 400 hPa. Over sea: IR winds above 700 hPa, WV above 550 hPa.
ECMWF Mean and Difference Wind Fields: 400 hPa Arctic: MODIS winds act to strengthen the circulation at upper levels; at lower levels the difference field suggests a weakening of the local circulation. Antarctic: MODIS winds act to strengthen the flow around the Antarctic Peninsula.
Forecast Impact (3DVAR) Anomaly correlation for 500 hPa geopotential, each experiment verified against its own analysis. Forecast scores are the correlation between the forecast geopotential height anomalies, with and without the MODIS winds, and their own analyses. Northern Hemisphere Arctic (N of 65N)
Forecast Impact (3DVAR, cnt’d) Anomaly correlation for 500 hPa geopotential, each experiment verified against its own analysis. Southern Hemisphere Antarctic (S of 65S)
Forecast Impact (4DVAR) Anomaly correlation for geopotential, each experiment verified against operational analysis. NH, 1000 hPa NH, 500 hPa
Forecast Impact (4DVAR, cnt’d) Anomaly correlation for geopotential, each experiment verified against operational analysis. SH, 1000 hPa SH, 500 hPa
Forecast Impact (4DVAR, cnt’d) N.POLE N.ATL EUROPE E.ASIA
ECMWF: Error Propagation to the Midlatitudes This animation illustrates the propagation of analysis errors from the poles to the midlatitudes for one case study. Each frame shows the 500 hPa geopotential height for forecasts from 1 to 5 days in 1 day increments. The solid blue line is the geopotential from the experiment that included MODIS winds; the dashed black line is the control (CTL) experiment without MODIS winds. Solid red lines show positive differences in the geopotential height (MODIS minus CTL), and thick dashed green lines show negative differences. The area of large positive differences near the Beaufort Sea (north of Alaska) moves southward over the 5-day period. The CTL run is forming a deeper trough over central Alaska and then over the Pacific south of Alaska than the MODIS run. The 5-day MODIS forecast verifies better against the subsequent analysis (not shown), so the initial analysis for this MODIS forecast was closer to the “truth” than the CTL (positive impact on forecast). The propagation of differences is therefore also a propagation of analysis errors in the CTL forecast. Better observations over the poles should improve forecasts in the midlatitudes.
Error Propagation to the Midlatitudes: Snowfall Accumulated snowfall forecasts (mm water equivalent) over Alaska for 20 March 2001. Inclusion of MODIS winds in the analysis can produce a more accurate forecast. At right is the snowfall from the 5-day Control forecast (no MODIS winds); below left is the snowfall from the 5-day forecast that included the MODIS winds in the analysis; below right is the snowfall from a 12-hr forecast for verification (“truth”).
Canadian Climate Centre (CMC) (Real Sarrazin) • Now: - Uniform resolution of 100 km (400 X 200 X 28) • - 3D-Var at T108 on model levels, 6-hr cycle, use of raw • radiances from AMSUA, AMSUB and GOES • 2004: - Resolution to ~35 km (800 X 600 X 56) - 4D-Var assimilation, 6-hr time window with 3 outer loops at full • model resolution and inner loops at T108 • - new datasets: profilers, MODIS winds, AMSUA on AQUA • - EnKF for EPS • 2005: - Top at 0.1 hPa (instead of 10 hPa) with additional AMSUA and • AMSUB channels (Clément`s presentation) • - assimilation of AIRS, MSG, MTSAT, QuikScat, SSM/IS • - revised 4D-Var statistics • 2006-07: - Additional datasets: IASI, GIFTS, COSMIC… • - very large increase in volume of assimilated data
CMC 3DVAR Impacts Nov 5 – Dec 15, 2003 Slight positive impact in the Arctic, positive in the Antarctic and SH, neutral in NH
MODIS winds: latest results at the Met OfficeMary Forsythe (1), Howard Berger (1,2)(1) Met Office, Exeter, UK(2)UW-CIMSS Madison, WI
100 200 300 400 500 Pressure (hPa) 600 700 800 900 1000 0 20 40 60 80 100 120 Number of winds Thousands Distribution of MODIS winds NESDIS Feb 04 Terra NH Terra SH Aqua NH Aqua SH 100 200 300 400 500 Pressure (hPa) 600 700 CSWV WV CSWV IR 800 900 1000 0 20 40 60 80 100 120 Number of winds Thousands • More Terra winds in NH than SH • More Aqua winds in SH than NH • SH winds (summer) peak at lower pressures
Some Statistical Comparisons to MetO background NESDIS Feb 04 Comparing Satellites Comparing Channels IR Terra NH
Verification vs OBS and ANAL 3 vs OBSERVATIONS vs ANALYSES 2 1 % RMS difference (experiment – control) 0 -1 -2 NH H500 T+72 NH H500 T+24 NH H500 T+48 SH H500 T+72 NH PMSL T+96 SH PMSL T+24 SH PMSL T+48 SH PMSL T+72 NH PMSL T+24 NH PMSL T+48 SH H500 T+24 SH H500 T+48 SH PMSL T+96 NH W250 T+24 SH W250 T+24 NH PMSL T+72 NH PMSL T+120 SH PMSL T+120 Trop W850 T+24 Trop W850 T+48 Trop W850 T+72 Trop W250 T+24
Conclusions • Winds from Aqua and Terra are of comparable quality. • Some benefits were observed in the forecasts when CSWV winds were included, blacklisting was modified and the thinning box was increased. • The NESDIS MODIS product compares better with MetO background than the CIMSS product. • The latest MODIS experiment at the Met Office, using the NESDIS MODIS winds, is the first to give neutral to positive impact in all latitude bands. • Direct broadcast should allow more MODIS winds to be used in the Met Office assimilation system.
MODIS Polar Winds Assimilation Experiments at JMA Masahiro Kazumori, Yoshiyuki Nakamura Numerical Prediction Division Japan Meteorological Agency
Impacts on Forecast • Anomaly Correlation and RMSE at 500hPa • Large improvement for both seasons in the N.H. • Neutral for the Tropics and the S.H. (no MODIS assimilation in these regions) • Change in the Arctic spread to the lower latitudes. • RMS forecast error of wind vectors were reduced. • Especially, improvements at 500hPa was remarkable. ( 500hPa was the level with maximum data number) • Improvements on typhoon track prediction • Small, but positive impacts were found at the later stage in the forecasts.
Z500AnomalyCorrelation Red:TEST Blue:CNTL Large improvements were found for the Northern Hemisphere.
RMS forecast error difference for 500hPa Z TEST minus CNTL (m) (m) (m) • Monthly mean difference for July 2003 1day forecast 3day forecast 5day forecast Positive Impacts of MODIS (negative difference) spread to mid-latitudes with procession of forecast.
Impacts on Forecast • Anomaly Correlation and RMSE at 500hPa • Large improvement for both seasons by 9-day forecasts • Neutral for the tropics and the S.H. (no MODIS assimilation) • Change in the Arctic spread to the lower latitudes. • RMS forecast error of wind vectors were reduced. • Especially, improvements at 500hPa were remarkable. ( 500hPa was the level with maximum data number) • Improvements on typhoon track prediction • Small, but positive impacts were found at the later stage in the forecasts.
Zonal mean of RMSE of Wind Speed at 500hPa(5-day forecasts,January2004) (m/s) Improvement (m/s) Improvement
Impacts on Forecast • Anomaly Correlation and RMSE at 500hPa • Large improvement for both seasons by 9-day forecasts • Neutral for the tropics and the S.H. (no MODIS assimilation) • Change in the Arctic spread to the lower latitudes. • RMS forecast error of wind vectors were reduced. • Especially, improvements at 500hPa was remarkable. ( 500hPa was the level with maximum data number) • Improvements on typhoon track prediction • Small, but positive impacts were found at the later stage in the forecasts.
Mean positional error of typhoon track predictions • 22 events in July 2003 • Neutral or slightly positive at the later stage in the forecast time.
Summary • The MODIS polar winds assimilation experiments were performed at JMA • Period:July 2003, January 2004 • Used data:Aqua/MODIS,Terra/MODIS in the Arctic • QC • Over land, above 400hPa for IR and WV • Over ocean, above 700hPa for IR and 550hPa for WV • Data thinning 150km • Results • Improvements on the analysis and first guess in the Arctic. • Large positive impacts on forecasts for both seasons. ( height, temperature, wind fields) • Improvements on the typhoon track prediction. JMA started the assimilation of MODIS polar winds in the Arctic operationally at 27 May 2004.
Usage of MODIS winds Usage: over Land and Oceans IR above 1000 hPa; over Antartica only above 700 hPa Wvcloudy above 700 hPa FG check: asymmetric to remove negative OBS-FG bias Thinning: 1 wind per pre-defined thinning box (oper.: 70 x 70 km; 15 vertical layers). Same observation errors as SATOB Experiments: CTL : Routine assimilation and forecast system using different kinds of observing systems (synops, buoys, aircraft, radiosondes, satob, satem, paob) Exp : CTL plus MODIS winds for a summer and an autuum case 7th Int. Winds Workshop Alexander Cress
Mean analysis diferences between Control + Modis and Control 7th Int. Winds Workshop Alexander Cress
Anomalie correlation date: 2003061200 - 2003070900 28 forecasts; verified against routine analyses SH forecast time h forecast time h 7th Int. Winds Workshop Alexander Cress
Anomalie correlation date: 2003061212 - 2003070912 28 forecasts; verified against routine analyses forecast time h forecast time h 7th Int. Winds Workshop Alexander Cress
500 hPa Geopotential Northern Hemisphere VV= +60h 7th Int. Winds Workshop Alexander Cress
Summary of MODIS wind results • Good correspondence between MODIS wind statistics and similar statistics for AMV winds from geostationary satellites • FG statistics look very similar between Terra and Aqua. • Some differences exists in the OBS-FG, OBS-ANA statistics between Terra and Aqua over Antartica • Large impact on polar analysis by introducing analysis increments in data void areas • Impact of MODIS winds depends strongly on season and occasions in which the interaction between polar and midlatitude flow patterns is particularly intense 7th Int. Winds Workshop Alexander Cress
MODIS Wind Assimilation NCEP’s Global Forecast System John Le Marshall (JCSDA) James Jung (CIMSS) John Derber (NCEP) Jaime Daniels (NESDIS) International Winds Workshop June 14, 2004
Global Forecast System Background • Operational SSI (3DVAR) version used • Operational GFS T254L64 with reductions in resolution at 84 (T170L42) and 180 (T126L28) hours. 2.5hr cut off
The Trial • Used MOWSAP (MODIS Winds Special Acquisition Period) data • NESDIS (Ops.) generated AMVs • 1 Jan – 15 Feb ‘04 • Terra & Aqua satellites • Similar assimilation methodology that used for GOES AMVs • Middle image used for tracers • AMVs largely used NESDIS QC • Post NESDIS QC used, particularly for gross errors cf. background and for winds above tropopause • Winds assimilated only in second last analysis (later “final” analysis) to simulate realistic data availability.