1 / 7

John Mills ISAT Comparative Study 2008-2012

John Mills ISAT Comparative Study 2008-2012. Reading and Math Sub-Groups. Demographics. ISAT 2012 (85%). ISAT Reading. ISAT Math. At or above 85%. 75% - 84%. 74% and below. High/Low Performers. Whole/Sub Group Target: 85% Highest

lottie
Télécharger la présentation

John Mills ISAT Comparative Study 2008-2012

An Image/Link below is provided (as is) to download presentation Download Policy: Content on the Website is provided to you AS IS for your information and personal use and may not be sold / licensed / shared on other websites without getting consent from its author. Content is provided to you AS IS for your information and personal use only. Download presentation by click this link. While downloading, if for some reason you are not able to download a presentation, the publisher may have deleted the file from their server. During download, if you can't get a presentation, the file might be deleted by the publisher.

E N D

Presentation Transcript


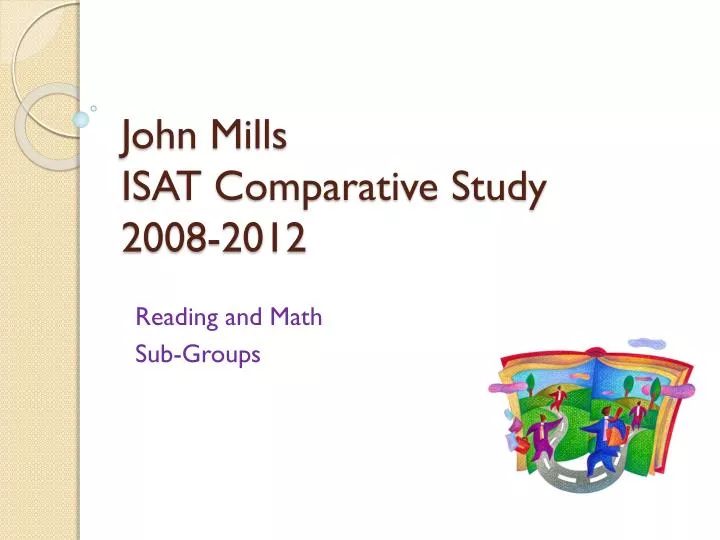
  1. John MillsISAT Comparative Study2008-2012 Reading and Math Sub-Groups

  2. Demographics

  3. ISAT 2012 (85%)

  4. ISAT Reading

  5. ISAT Math

  6. At or above 85% 75% - 84% 74% and below

  7. High/Low Performers Whole/Sub Group Target: 85% Highest Performing 1. 6th Gr. Girls Math 93.3% 2. 6th Gr. Girls Reading 91.6% 3. 6th Gr. White Math 90.4% Lowest Performing 1. LEP 5th Grade Math (6 students) 16.6% 2. LEP Reading 4th/5th Gr. 33.3% 3. LEP Reading 3rd Gr. 35.2% 4. IEP Reading 4th Gr.36.8% 5. IEP Reading 5thgrade 37.5%

More Related