Download
1 / 13
140 likes | 1.14k Vues
D P S E E A Christchurch, winter evening, 23July 2001, 6.30 p.m. Driving forces : Energy policy, Housing policy, economic growth, “poverty”, SES Pressures : amount of polluting fuels used (wood, coal), number of chimneys State of environment:

E N D
D P S E E A
Driving forces: Energy policy, Housing policy, economic growth, “poverty”, SES Pressures: amount of polluting fuels used (wood, coal), number of chimneys State of environment: outdoor air quality, indoor air quality, “chimney density” and cold, calm days Exposures: time spent in polluted air, indoor/outdoor exposures, actual inhaled amounts of pollutants Effects: Resp. and CVD deaths, hospital admissions, asthma, COPD, restricted activity days, economic impact Actions: at each level of DPSEEA DPSEEA: Air pollution due to household heating
Pressure (chimneys) to State (chimney density) indicators. Kjellstrom and Exeter, 1999 D P S E E A 1996 census data; households using wood or coal as primary heating source (C); assuming one chimney per household: CD = chimney density = C / km2 (size of census area)
Christchurch heating air pollution analyzed by DPSEEA D P S E E A • Chimney density correlated with air poll. monitoring results in the same area: Pressure to State to Exposure • Areas with high chimney density (S) also has low SES status (D)(Hales et al., 2000). • In epidemiological analysis both SES and chimney density are associated with increased mortality: Driving force to Pressure/State to Effect
D P S E E A Plot of residual of Poisson model without PM10 against the level of PM10 in Christchurch Each point is an average of 20 adjacent points sorted by PM10
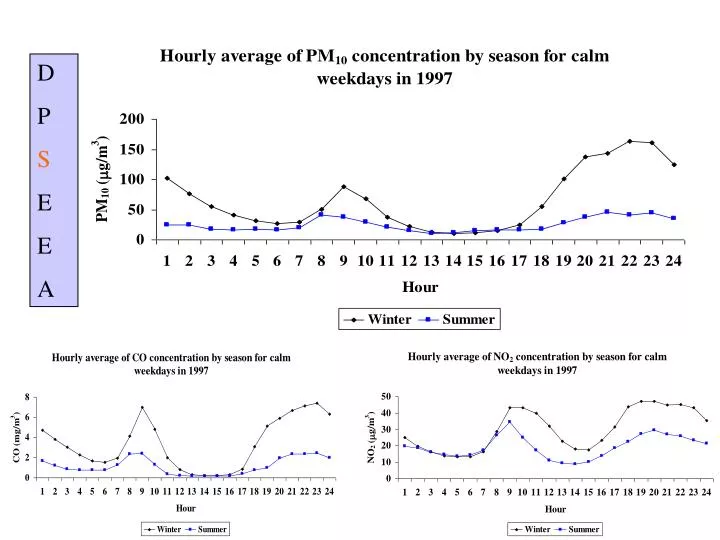
Daily mortality as a function of season and PM10 Daily deaths D P S E E A PM10, ug/m3
Christchurch epidemiological studyPoisson regression result (1988 - 1997) D P S E E A Best Model Response : Total deaths The 24 hour average level of PM10 on the day prior to death and the variable HOT (created based on 1 hour maximum temperature) on the day of death had the statistically strongest association with the number of daily deaths. Hales, Kjellstrom, Shrestha et al., 2002 The coefficients can be considered as indicators of env. health impact
Driving forces: Transport policy, public transport provision, economic growth, “poverty”, SES Pressures: amount of fuel used, number of vehicles State of environment: outdoor air quality, indoor air quality, vehicle density and calm days Exposures: time spent in polluted air (including inside vehicles), actual inhaled amounts of pollutants Effects: Resp. and CVD deaths, hospital admissions, asthma, COPD, lung cancer, restricted activity days, economic impact Actions: at each level of DPSEEA DPSEEA: Air Pollution from Transport
Slide with Maps of Auckland air pollution and socio-economic deprivation
Driving forces: Coal ban and Open fire ban (CHC), Public transport investment (AKL) Pressures: Subsidies for efficient wood burners (CHC) State of environment: improved air quality monitoring and modelling Exposures: improved insulation, ventilation of houses to reduce indoor levels reduced time in traffic jams Effects: Improved acute care and early warning system for vulnerable people Actions and indicators: Household heating, Transport, Air Pollution D P S E E A
International initiatives to build bridges: Public Health and Environment • Europe: major joint policy meetings of Ministers of Health and Environment • UNCSD: Creating core lists of Sustainable Development Indicators (but, lack of attention to existing WHO Health Indicators) • WHO: Ongoing analysis of Burden of Disease for several environmental risk factors, including Global Climate Change • Selected countries, e.g. Australia, Sweden: developing and testing innovative indicators (e.g. obesogenic environment indicators)
“100% pure” environment. The end. Thank you !