Download
1 / 28
280 likes | 706 Vues
Newport News Waterworks Impact of Climate Change on Water Supplies of Coastal Communities Brian L. Ramaley, P.E. Director, Newport News Waterworks and President, Association of Metropolitan Water Agencies (AMWA) World Water Week 21 August 2008

E N D
Newport News Waterworks Impact of Climate Change on Water Supplies of Coastal Communities Brian L. Ramaley, P.E. Director, Newport News Waterworks and President, Association of Metropolitan Water Agencies (AMWA) World Water Week 21 August 2008
Comprises the largest publicly owned U.S. metropolitan water systems Members provide drinking water to over 127 million people in the U.S. Focus on the U.S. Congress, the Administration and Management Issues facing metropolitan water suppliers. New focus: Climate Change and International Outreach and Knowledge Exchange. AMWA – Leaders in Water
Expand and enhance AMWA's value to US metropolitan drinking water utilities through access and engagement with similar metropolitan utilities in other countries. Exchange experience and knowledge with utility managers abroad and to provide opportunities for peer-to-peer exchange of ideas and skills. International knowledge exchange on climate change matters is of greatest importance. AMWA’s International Involvement
Presentation Outline • Background on Newport News Waterworks • Specific Impacts of Climate Change • Conclusions for the Future
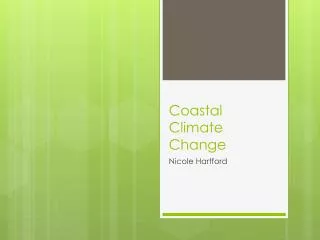
Newport News Waterworks • Municipally owned system that serves drinking water to more than 400,000 people • 3 cities, two counties, many military bases • Mid-Atlantic location at mouth of Chesapeake Bay • In coastal plain, average elevation < 10 meters
Month Avg. High Avg. Low Mean Avg. Precip Jan 47°F 32°F 39°F 4.08 in. Feb 49°F 34°F 42°F 3.60 in. Mar 57°F 41°F 49°F 4.73 in. Apr 66°F 49°F 57°F 3.35 in. May 73°F 58°F 66°F 4.03 in. Jun 81°F 67°F 74°F 3.44 in. Jul 85°F 72°F 79°F 4.86 in. Aug 84°F 71°F 77°F 4.74 in. Sep 78°F 65°F 72°F 4.84 in. Oct 68°F 53°F 61°F 3.45 in. Nov 60°F 44°F 52°F 3.35 in. Dec 51°F 36°F 44°F 3.43 in. Newport News Climate Information
Newport News - Location Stockholm–> Atlantic Ocean Newport News Virginia North Carolina
Newport News, VA Waterworks System and Water Sources • Interconnected pumped storage reservoirs and one river intake • Chickahominy River is major water source • Surface water ----- 57 mgd safe yield based on 75-year record • Groundwater desalination ----- 6 mgd yield • 1 mgd = 3,785 cubic meters per day • 10,000 cubic meters per day = 2.64 mgd
Climate Change Impacts to Coastal Water Supplies • Warmer temperatures • Changing precipitation patterns • Rising sea level
Warmer Temperatures • Higher evaporation/lower yield • Higher demand • Increased biological activity and impacts on water quality/treatability
Changing Precipitation Patterns • More intense rainfall events/storms • Increased turbidity/sediment/treatment required • Faster reservoir refill – shoreline erosion • Spillways must pass more water • Storm damage to facilities – redundancy/reliability issues? • More frequent, intense or prolonged droughts • Higher irrigation demand • Reduced surface system yields during drought • Reduced groundwater recharge/yield
Rising Sea Level • Inundation of service area • Surge impacts to low lying areas during storms including water utility facilities are magnified • Salt water intrusion into surface supplies • Salt water intrusion into groundwater • Accelerated subsidence
Summary of Historical Drought Studies: Newport News • Water supply planning in Eastern U.S. is typically based on most severe drought in 20th Century (e.g., 1930) • Firm Yield of 57 mgd for 78-year streamflow record estimated for surface system based on 1930-2008 record
Updating Drought Studies to Include 19th Century Records • Monthly rainfall records extend back to 1836 for Southeastern and Central Virginia • Standardized Precipitation Index (SPI) method was used to compare 19th and 20th Century rainfall records • Synthesized streamflows developed from rainfall records • Performed Firm Yield modeling with a 161-year streamflow record
Rain Gauge Locations Powhatan Hill, 1849-1876 Fredericksburg, 1893-1998 Richmond, 1872-1998 Williamsburg, 1900-1998 Hopewell, 1888-1998 Newport News, 1899-1927 Hampton, 1869-1913 Fort Monroe, 1836-1890 Norfolk, 1871-1998
20 15 Monthly Rainfall (inches) 10 5 0 1836-1899 1900-1998 1836-1998 Monthly Rainfall Datasets 19th and 20th Century Rainfall Data Show Similar Means and Distributions
Results of Firm Yield Modeling with 161-Year Streamflow Record • Four 19th Century droughts are more severe than the worst 20th Century drought • Minimum Firm Yield is 42 mgd (1851-55 drought) • 20th Century drought of record (1930): 57-mgd Firm Yield corresponds to a 22-year return period (rather than a 75-year return period) • Firm Yield for a 75-year return period is 44.5 mgd
Implications for Water Supply Planning Studies Consideration of 19th Century droughts can significantly change evaluations of existing system reliability and future needs. Recent droughts and storms indicate a return to precipitation conditions in the mid-Atlantic region more like the 1800s than the 1900s. Are the 1800s a better model for climate change impacts with respect to yield?
Estimated Sea Level Rise at NN – 3 to 4 mm/year Relative Sea Level Rise Along the East Coast of North America From Zhang et al. (2004) Climatic Change 64: 41–58.
Hurricane Isabel Sep 18-19, 2003 Reagan Washington National Airport Chesapeake Inundation Prediction System (CIPS) SLR 2008 SLR 2025 SLR 2050 SLR 2075 SLR 2100
Hampton Roads Inundation Estimates Under Different Sea Level Rise Scenarios • Extent of flooding is a function of: - height of water • - land elevation • - land relief • With increasing sea level, additional flooding from storm surge effects will be greater than previously - smaller storms will have equivalent destruction potential as larger storms pre-SLR • Important implications for both human populations as well as living resources and coastal environments From Titus and Wang (2008) EPA.
Conclusions for the future • Climate change will impact coastal water supplies in multiple ways • Regional modeling and downscaling of global models are needed to predict temperature, sea level rise, design storms and droughts • Combination of impacts must be considered • Existing yields and safety factors are almost certainly wrong – high or (more likely) low
Conclusions for the future • Diversification of water supplies will enhance reliability – Security Through Diversity • Looking further back in time may be a useful way of estimating the future climate • Integrated resource planning principles offer a roadmap • Redundancy/reliability concerns should be given more attention in the face of an uncertain future