Download
1 / 1

E N D
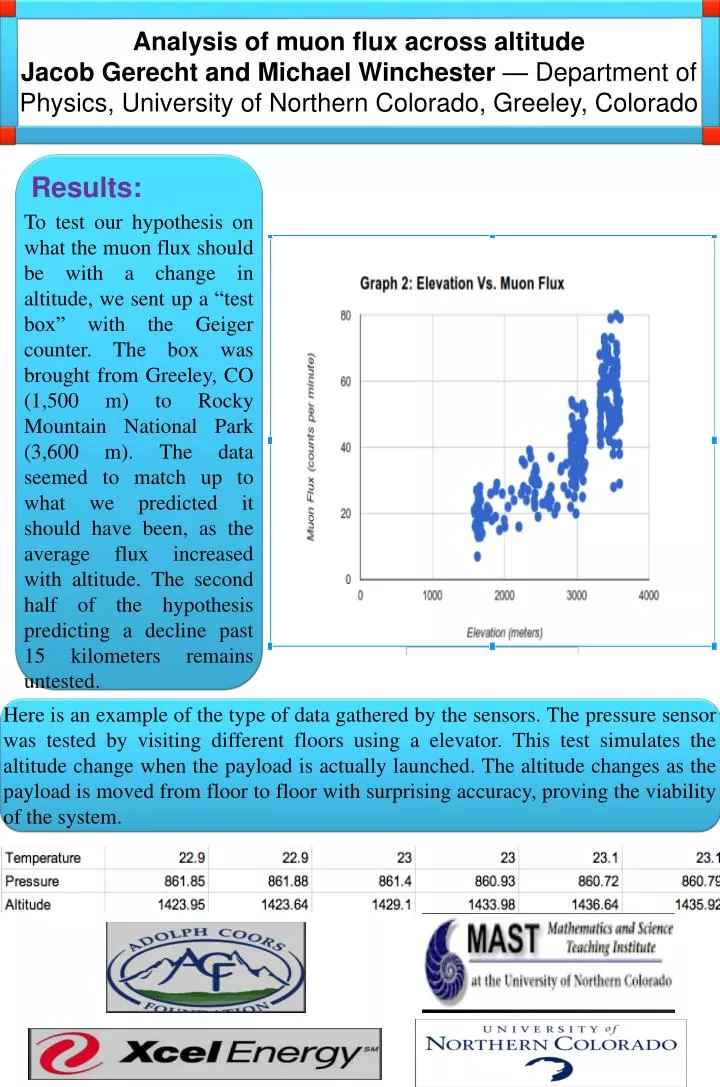
23.5 in Results: To test our hypothesis on what the muon flux should be with a change in altitude, we sent up a “test box” with the Geiger counter. The box was brought from Greeley, CO (1,500 m) to Rocky Mountain National Park (3,600 m). The data seemed to match up to what we predicted it should have been, as the average flux increased with altitude. The second half of the hypothesis predicting a decline past 15 kilometers remains untested. Analysis of muon flux across altitude Jacob Gerecht and Michael Winchester — Department of Physics, University of Northern Colorado, Greeley, Colorado 35.5 in Here is an example of the type of data gathered by the sensors. The pressure sensor was tested by visiting different floors using a elevator. This test simulates the altitude change when the payload is actually launched. The altitude changes as the payload is moved from floor to floor with surprising accuracy, proving the viability of the system.