Download
1 / 32
350 likes | 481 Vues
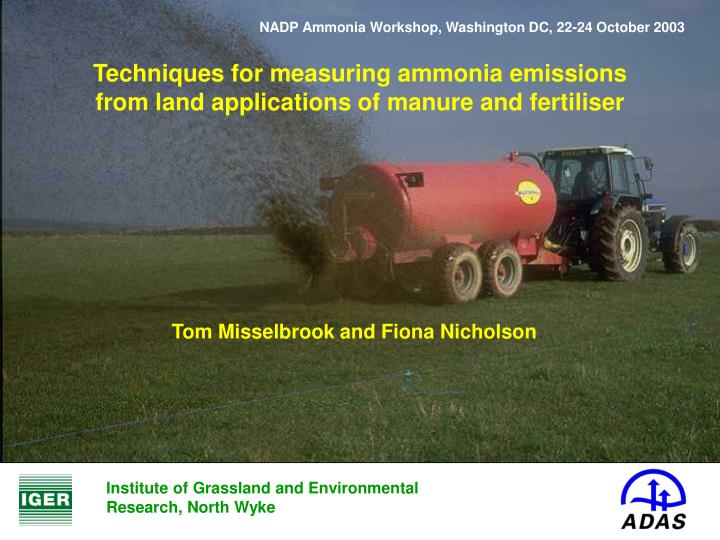
NADP Ammonia Workshop, Washington DC, 22-24 October 2003. Techniques for measuring ammonia emissions from land applications of manure and fertiliser. Tom Misselbrook and Fiona Nicholson. Institute of Grassland and Environmental Research, North Wyke. Structure of presentation.

E N D
NADP Ammonia Workshop, Washington DC, 22-24 October 2003 Techniques for measuring ammonia emissions from land applications of manure and fertiliser Tom Misselbrook and Fiona Nicholson Institute of Grassland and Environmental Research, North Wyke
Structure of presentation • Techniques available • Micrometeorological • Enclosure • Samplers for measuring concentration (or flux) • Most commonly-used methodologies • Micrometeorological mass balance • Wind tunnels • Equilibrium concentration technique • Conclusions
Techniques available • Soil N balance, 15N Micrometeorological techniques Mass balance Eddy correlation Gradient methods Backward Lagrangian stochastic model Equilibrium concentration technique Enclosure techniques Static chambers Dynamic chambers Controlled release ratio techniques
Micrometeorological techniques Mass balance – Integrated Horizontal Flux upwind mast downwind mast wind direction horizontal NH3 flux vertical NH3 flux manure-treated surface x Flux from treated area = (IHFdw - IHFuw) / x
Micrometeorological Mass Balance (IHF) technique Passive flux samplers mounted on a mast
Micrometeorological techniques Mass balance – other methods Theoretical profile shape – measure flux at 1 predetermined height (Zinst) TPS Philip’s solution – flux derived from measured concentration profile and theoretically calculated concentration profile for unit flux Perimeter profile method – measure inward and outward fluxes at several heights around the perimeter of a treated circular plot
Micrometeorological techniques Eddy correlation w’ – fluctuation in vertical wind speed (sonic anemometer) x’ - deviation from mean concentration (TDL) Relaxed eddy accumulation b – empirical constant sw–standard deviation in vertical wind x+ - mean concentration, updraft x- - mean concentration, downdraft Sonic anemometer Wet chemistry (e.g. denuder)
Micrometeorological techniques Gradient methods Measure concentration, wind speed and temperature at 2 or more heights Constant flux layer Flux = K dX/dz fetch:height 100:1
Micrometeorological techniques Backward Lagrangian stochastic model u is windspeed, c is ammonia concentration n is a constant Flux = uc/n Software commercially available At it’s simplest, requires measurement of windspeed and concentration at only 1 height
Equilibrium concentration technique Flux = (Ceq - Ca,z) Kz,a
Enclosure techniques Static chambers Concentration Time
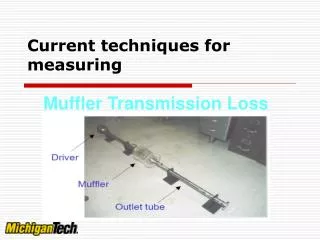
Enclosure techniques Dynamic chambers – wind tunnels Flux = V (Cout - Cin) / A
Controlled Release Ratio technique Cb Cs Cp Fluxp = f (Cp - Cb) where f = Fluxs/(Cs-Cb)
Samplers • Laser/optical instruments - TDL, DOAS, FTIR
Laser/optical Instruments • Advantages: • very sensitive • fast response (real-time results) • Disadvantages: • cost • require power
Samplers • Optical absorption samplers - TDL, DOAS, FTIR • Absorption flasks
Absorption flasks • Advantages: • inexpensive • simple • can be used for a wide concentration range • Disadvantages: • require power • time-averaged concentration measurements • freezing/evaporation problems
Samplers • Optical absorption samplers - TDL, DOAS, FTIR • Absorption flasks • Denuders • Filters/badges
Filters/badges • Advantages: • inexpensive • simple • no power requirement • Disadvantages: • labour intensive • time-averaged concentration measurements • difficulty in estimating required exposure times
Samplers • Optical absorption samplers - TDL, DOAS, FTIR • Absorption flasks • Denuders • Filters/badges • Passive flux samplers
Passive flux samplers – “shuttles” • Advantages: • direct measurement of flux • no power requirement • simple • Disadvantages: • cost? ($300-400 each) • time-averaged flux measurement
Sampler inter-comparison tests • Concentration range 80 – 7,500 ug N m-3 • Exposure time 1 – 6 hours • Absorption flasks – 2 in series • acid concentration (0.1, 0.01, 0.001M) • air flow rate (0.6 – 3.5 l min-1) • end type (scintered glass, open) • Badges • Shuttles • angle if incidence of air flow (20o, 40o)
Sampler inter-comparison tests • Absorption flasks • Mean capture in 1st flask 97% • No sig. effect of acid strength • No sig. effect of air flow rate • No sig. effect of end type • Shuttles • No sig. effect of angle of incidence
Sampler inter-comparison tests Shuttles vs. absorption flasks
Sampler inter-comparison tests Badge vs. absorption flasks
Sampler inter-comparison tests Sampler repeatability
Sampler inter-comparison tests ‘Blank’ values and detection limits (ug N)
Technique inter-comparisons ECT Circular manure-treated plot 3 replicate plots 4 experiments (different manure types) MB IHF Wind tunnels
Technique inter-comparisons Coefficients of variation (%) in measured emission rates * many missing data
Choice of technique IHFWind tunnelsECT type of study absolute comparative comparative ease of replication * *** *** land area required *** * * capital cost * *** * labour costs * ** *** practicality * * ** variability ** ** ** overall reliability *** ** * * low, ** medium, *** high
Conclusions • Large number of techniques available • Overall methodology • Sampling concentration/flux • CV of measurement techniques lowest for MB-IHF • CV of measurements lower for slurries than solid manures • Choice of technique depends on purpose and resources available • Still room for the development of a non-intrusive small plot technique