Download
1 / 26
260 likes | 263 Vues
This report analyzes retail sales performance for the holiday weeks of Halloween, Thanksgiving, Christmas, and New Year's Eve for the Avocado category in the US. It includes sales data, average prices, volume growth rates, and regional trends.

E N D
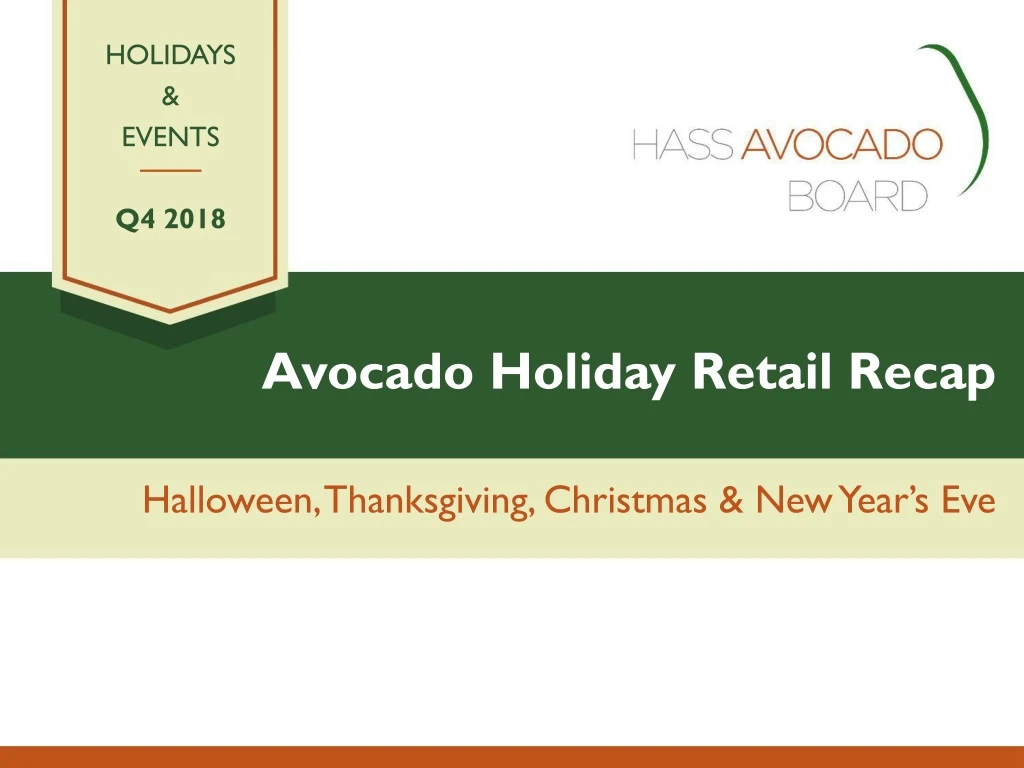
Avocado Holiday Retail Recap Halloween, Thanksgiving, Christmas & New Year’s Eve HOLIDAYS & EVENTS Q4 2018
Definitions • This report looks at retail sales performance for the four holiday and event weeks* listed below: • Halloween – week ending 11/4/2018 • Thanksgiving – week ending 11/25/2018 • Christmas – week ending 12/23/2018 • New Year’s – week ending 12/30/2018 • Category: Avocados • Geographies: • Total U.S. • Regions • Retail POS data source: IRI / FreshLook *IRI data is provided in weekly increments, with each week ending on a Sunday. Weeks shown are the best fit for the holidays in this report. HAB's calculation is based in part on data reported by Information Resources, Inc. through its Freshlook Service for the Avocado category for Multi-Outlet (MULO). The information is believed to be reliable at the time supplied by IRI but is neither all-inclusive nor guaranteed by IRI. Without limiting the generality of the foregoing, specific data points may vary considerably from other information sources.
Halloween week ending 11/4/2018 Spooky avocado dishes are a delicious way to set the mood at any Halloween bash. This year, avocado unit and dollar sales grew to four-year highs for Halloween, with $42.5MM in avocado sales.
Avocado sales hit four-year highs for Halloween Holiday Week Sales and Average Price by Year (Dollars and Units in millions) Dollars Units ASP • A significant increase in volume drove dollar sales for Halloween, despite a decline in ASP • 2018 sales topped 2015 by +29% in dollars and +25% in units Source: IRI/FreshLook week ending 11/4/2018
Dollar sales growth rates varied across the regions for Halloween Dollar Sales and % Change • Halloween dollar sales of avocados increased +1% nationally vs. prior year, hitting $42.5MM for the week • Regional dollar growth rates ranged from a gain of +10% in West to a decline of -8% in South Central • Nationwide, avocado retailers averaged $446 in dollar sales for the week • Per store dollar sales were especially strong in West ($955) and California ($865) Total U.S. $42.5MM +1% Dollars per Store Selling Total U.S. Avg. = $446 Source: IRI/FreshLook week ending 11/4/2018
Volume shows double-digit growth rates across all regions except California for Halloween Unit Sales and % Change • Nationally, volume grew +27% for Halloween week to 40.6MM units • All regions except California (+6%) showed double-digit growth, ranging from +25% in Great Lakes to +48% in Plains • On average, avocado retailers saw sales of 426 units per store during the week of Halloween • West (920), California (771), and South Central (562) units/store exceeded the national average Total U.S. 40.6MM +27% Units per Store Selling Total U.S. Avg. = 426 Source: IRI/FreshLook week ending 11/4/2018
Nationally, average price per unit decreased -20% Total U.S. $1.05 -20% South Central $0.80 -28% Midsouth $1.11 -24% Great Lakes $1.15 -25% Southeast $1.01 -22% low high West $1.04 -17% Plains $0.93 -33% California $1.12 -8% Northeast $1.30 -16% • There was a wide range of prices across the regions for the week of Halloween, from a low of $0.80/unit in South Central to a high of $1.30/unit in Northeast • All regions experienced a decrease in average price, ranging from -8% to -33% Source: IRI/FreshLook week ending 11/4/2018
Halloween Total U.S. category volume increased +8.6MM units Dollar Growth by Region (in millions) Unit Growth by Region (in millions) • Three of eight regions contributed to Halloween dollar growth of +$0.4MM, with West (+$0.7MM) showing the greatest increase • All regions grew units, with West (+1.8MM), Southeast (+1.6MM), South Central (+1.6MM), and Northeast (+1.1MM) each posting growth over one million incremental units Source: IRI/FreshLook week ending 11/4/2018
Avocados are a great way to elevate and add a refreshing touch to classic Thanksgiving dishes. In 2018, Thanksgiving sales may have been impacted by limited avocado supply. Thanksgiving week saw a -22% decline in units Thanksgiving week ending 11/25/2018
In 2018, Thanksgiving sales may have been impacted by limited avocado supply Holiday Week Sales and Average Price by Year (Dollars and Units in millions) Dollars Units ASP • Thanksgiving posted 24.1MM units and $30.6MM, a -22% decline in volume and -17% decline in dollar sales vs. 2017 Source: IRI/FreshLook week ending 11/25/2018
Thanksgiving dollar trends were down across all regions Dollar Sales and % Change • Nationally, Thanksgiving sales fell to $30.6MM, an decline of -17% vs. prior year • All regions showed double-digit volume declines • Nationwide, avocado retailers averaged $326 per store for the week of Thanksgiving • California ($719) posted per store dollar sales of more than double the national average. West ($599) also showed significant sales per store for the holiday week Total U.S. $30.6MM -17% Dollars per Store Selling Total U.S. Avg. = $326 Source: IRI/FreshLook week ending 11/25/2018
Thanksgiving volume also declined across all regions Unit Sales and % Change • Thanksgiving volume declined -22% nationally to 24.1 million units • Volume sales were down across all regions • Avocado retailers sold an average of 257 units of avocados per store during the week of the Thanksgiving celebration • Three territories rose above the Total U.S. average units per store (257): West (469), California (452) and South Central (312) Total U.S. 24.1MM -22% Units per Store Selling Total U.S. Avg. = 257 Source: IRI/FreshLook week ending 11/25/2018
Thanksgiving ASP increased in five of eight regions Total U.S. $1.27 +6% Great Lakes $1.26 +1% West $1.28 +20% Northeast $1.45 +6% South Central $0.92 -8% low high Plains $1.30 +13% Southeast $1.15 -8% Midsouth $1.27 -6% California $1.59 +24% • Across the U.S., average pricing during Thanksgiving increased +6% to $1.27/unit • Average pricing for Thanksgiving ranged from a low of $0.92/unit in South Central to a high of $1.59/unit in California Source: IRI/FreshLook week ending 11/25/2018
Sales declined across all regions for Thanksgiving Dollar Growth by Region (in millions) Unit Growth by Region (in millions) • Dollar sales decreased -$6.5MM nationally, with dollar declines in all regions • Unit sales were also down ($-6.8MM nationally), with volume declines in all regions Source: IRI/FreshLook week ending 11/25/2018
Christmas week ending 12/23/2018 Avocados can add a little more green to holiday dishes and are a perfect way to enhance Christmas festivities. This year, avocados delivered more green to U.S. retailers during Christmas week, with volume up +19% over 2017.
Christmas week avocado dollar sales have increased more than +50% since 2015 Holiday Week Sales and Average Price by Year (Dollars and Units in millions) Dollars Units ASP • Dollar sales for Christmas week continued to trend upward, with $40.6MM in 2018 • Volume also increased for Christmas, reaching new heights for the holiday week Source: IRI/FreshLook week ending 12/23/2018
Christmas avocado dollar sales grew in nearly every region Dollar Sales and % Change • Nationally, dollar sales for Christmas increased +8% over 2017 • 6 of 8 regions showed growth in dollar sales with West leading at 16% • On average, avocado retailers saw sales of $427 per store during the holiday week • Per store sales were above the Total U.S. average in West ($915), California ($854), and South Central ($438) Total U.S. $40.6MM +8% Dollars per Store Selling Total U.S. Avg. = $427 Source: IRI/FreshLook week ending 12/23/2018
Christmas avocado volume soared across all regions Unit Sales and % Change • Nationally, Christmas volume rose +19% to 36.9MM units, with strong trends in all eight regions • Southeast had the highest volume growth rate among the regions at +42% • On average, avocado retailers saw sales of 388 units per store during the holiday week • West, California and South Central had per store unit sales above the national average Total U.S. 36.9MM +19% Units per Store Selling Total U.S. Avg. = 388 Source: IRI/FreshLook week ending 12/23/2018
Average prices decreased for Christmas week Total U.S. $1.10 -9% Midsouth $1.21 -6% South Central $0.87 -14% West $1.07 -5% California $1.14 -0% low high Great Lakes $1.10 -16% Southeast $1.06 -23% Plains $1.21 -5% Northeast $1.33 -5% • Nationwide, average price for Christmas fell -9% to $1.10/unit • All regions experienced declines in pricing with South Central lowest at $0.87 (-14%) and Northeast highest at $1.33 (-5%) Source: IRI/FreshLook week ending 12/23/2018
Christmas volume up across all regions Dollar Growth by Region (in millions) Unit Growth by Region (in millions) • All regions contributed to Total U.S. volume growth of +6.0MM units • All regions delivered unit growth, with Southeast and West each delivering more than +1.0MM units Source: IRI/FreshLook week ending 12/23/2018
New Year’s Eve week ending 12/30/2018 Nothing is better than a fresh start with fresh avocados. This year, shoppers added fresh avocados to their New Year's Eve dishes, driving volume sales up +13% over 2017.
Avocado sales continue to climb for New Year's Eve Holiday Week Sales and Average Price by Year (Dollars and Units in millions) Dollars Units ASP • Dollar sales for New Year's Eve continued to trend upward, with $42.9MM in 2018 • Volume also increased for New Year's Eve, reaching new heights for the holiday week Source: IRI/FreshLook week ending 12/30/2018
New Year's Eve dollar sales grew in five of eight regions Dollar Sales and % Change • Nationally, dollar sales for New Year's Eve increased +6% over 2017 • 5 of 8 regions showed growth in dollar sales with Northeast leading at 17% • On average, avocado retailers saw sales of $452 per store during the holiday week • Per store sales were above the Total U.S. average in West ($930), California ($867), and South Central ($459) Total U.S. $42.9MM +6% Dollars per Store Selling Total U.S. Avg. = $452 Source: IRI/FreshLook week ending 12/30/2018
New Year's Eve volume grew in six of eight regions Unit Sales and % Change • Nationally, New Year's Eve volume rose +13% to 45.1MM units • Plains had the highest volume growth rate among the regions at +29% • On average, avocado retailers saw sales of 475 units per store during the holiday week • West, California and South Central had per store unit sales above the national average Total U.S. 45.1MM +13% Units per Store Selling Total U.S. Avg. = 475 Source: IRI/FreshLook week ending 12/30/2018
ASP decreased across six of eight regions Total U.S. $0.95 -6% Great Lakes $0.92 -2% Midsouth $1.01 +2% South Central $0.71 -20% West $1.00 +4% low high Plains $0.81 -22% Southeast $1.00 -13% California $0.96 +2% Northeast $1.25 -8% • Nationwide, average price for New Year's Eve fell -6% to $0.95/unit • Nearly every region experienced declines in average price. South Central had the lowest ASP at $0.71/unit (-20%) and Northeast had the highest ASP at $1.25 (-8%) Source: IRI/FreshLook week ending 12/30/2018
New Year's Eve dollars were up across most regions Dollar Growth by Region (in millions) Unit Growth by Region (in millions) • Seven of eight regions contributed to Total U.S. dollar growth of +$2.3MM • Six of eight regions contributed to Total U.S. unit growth of +5.1MM units. Northeast, Southeast and South Central each delivered more than +1.0MM incremental units Source: IRI/FreshLook week ending 12/30/2018