Download

1 / 32
320 likes | 450 Vues
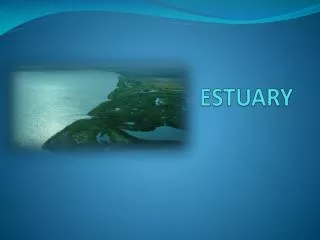
ESTUARY RESPONSES PROJECT. (ERP). MATAGORDA BAY. SAN ANTONIO BAY. ARANSAS/ COPANO BAY. CORPUS CHRISTI BAY. Colorado. Lavaca/ Navidad. Guadalupe. Aransas/Mission/ Copano. Nueces. SOUTH TEXAS ESTUARY SYSTEM. SALINITY INTRUSION. THE “ESTUARY”. ESTUARY RESPONSES PROJECT. STUDY TASKS.

E N D
MATAGORDA BAY SAN ANTONIO BAY ARANSAS/COPANO BAY CORPUS CHRISTI BAY
Colorado Lavaca/Navidad Guadalupe Aransas/Mission/Copano Nueces SOUTH TEXASESTUARY SYSTEM
ESTUARY RESPONSES PROJECT STUDY TASKS DATA BASE DEVELOPMENT HYDROGRAPHY CHEMISTRY BIOLOGY
DATA BASE DEVELOPMENT DATABASE MANAGEMENT PLATFORM User-friendly PC-based Data-processing options Variety of formats Transportable HISTORICAL DATA RECORD Data recovery Q/A Input & keyboarding Documentation EXTENSION & EXPANSION AS NEEDED
ESTUARY RESPONSES PROJECT STUDY TASKS DATA BASE DEVELOPMENT HYDROGRAPHY CHEMISTRY BIOLOGY
HYDROGRAPHY EXCHANGE & TRANSPORT Historical hydrology Volume budgets Tide & wind response Cedar Bayou history SALINITY RESPONSES Salinity history S vs Q relations Intertidal variation Spatial structure MODELING Selection Validation Implementation Application
ESTUARY RESPONSES PROJECT STUDY TASKS DATA BASE DEVELOPMENT HYDROGRAPHY CHEMISTRY BIOLOGY
CHEMISTRY PHOTOSYNTHESIS/RESPIRATION ANALYSIS Primary production calculations Hydrographic & climate effects Nutrient effects NUTRIENTS Loadings & budgets Controls SUSPENDED SOLIDS & TURBIDITY Loadings TSS vs Q TSS vs windwaves Turbidity effects
ESTUARY RESPONSES PROJECT STUDY TASKS DATA BASE DEVELOPMENT HYDROGRAPHY CHEMISTRY BIOLOGY
BIOLOGY MACROFAUNA RESPONSES Key species life cycles Abundance time/space analysis External controls & analysis HABITATS & ECOLOGICAL ASSEMBLAGES Marsh characterization Ecological index evaluation Oyster reef status Modeling? BENTHOS MONITORING & ANALYSIS
CONTINUED WORK ON THE ERP CONTINUED DEVELOPMENT OF THE DATABASE MANAGER, SUPPORTED BY GBRA & SARA CONTINUED DATA-RECOVERY EFFORT, SUPPORTED BY SARA & GBRA INFLOW DATA COMPILATION & SUMMARY REPORT,SUPPORTED BY CIAP (2009) TIME LINE OF CEDAR BAYOU, SUPPORTED BY CIAP (2009) LIFE HISTORY LIT REVIEW FOR THE BLUE CRAB, SUPPORTED BY CIAP (2009) ANALYSIS OF SALINITY AND TSS RESPONSES, IN PROGRESS, SUPPORTED BY CIAP (2010)
Advantage of San Antonio Bay for evaluating responses Almost the entirety of the freshwater input to the system enters at the head of the estuary San Antonio Bay has relatively small intensity of development around its periphery There is no deep-draft ship channel transecting the bay The volume of San Antonio Bay is small compared to the flood freshets that enter the bay The Bay is located on a climatological gradient between the humid northern coast, and the arid southern coast The effects of high inflows and low inflows tend to be sustained for much longer periods than is the case for bays with freer exchange with the sea