Download
1 / 25
250 likes | 355 Vues
Proposed NCEO Land Core posts. CEH : Hydrological aspects and coupling with atmosphere KCL: Fire emissions and their use in atmospheric monitoring, modelling and forecasting Exeter: adJULES Leicester: Land Surface Temperature Edinburgh : Ecosystems, DA and scaling

E N D
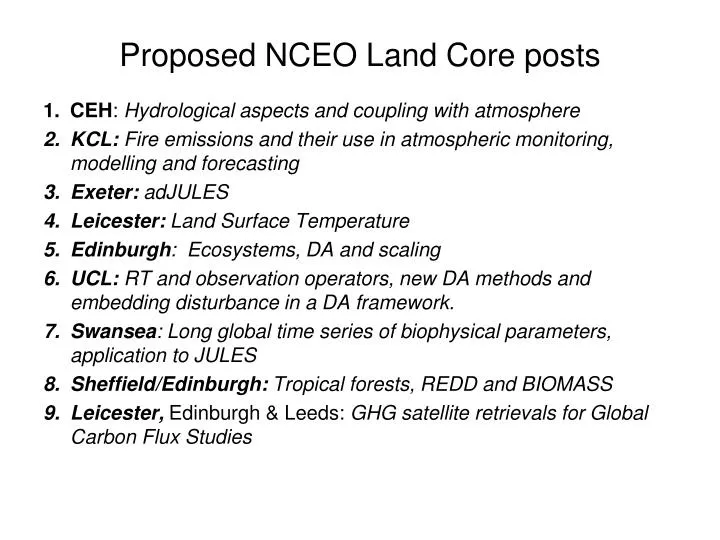
Proposed NCEO Land Core posts • CEH: Hydrological aspects and coupling with atmosphere • KCL:Fire emissions and their use in atmospheric monitoring, modelling and forecasting • Exeter: adJULES • Leicester:Land Surface Temperature • Edinburgh: Ecosystems, DA and scaling • UCL: RT and observation operators, new DA methods and embedding disturbance in a DA framework. • Swansea: Long global time series of biophysical parameters, application to JULES • Sheffield/Edinburgh: Tropical forests, REDD and BIOMASS • Leicester, Edinburgh & Leeds: GHG satellite retrievals for Global Carbon Flux Studies
Tropical deforestation, degradation and above-ground biomass Shaun Quegan, Martin Whittle (University of Sheffield) Mat Williams (University of Edinburgh)
Human Perturbation of the Global Carbon Budget 2000-2010 (PgC y-1) 7.9±0.5 1.0±0.7 2.5±1.0 (Residual) 4.1±0.2 2.3±0.5 (5 models) Global Carbon Project 2011; Updated from Le Quéré et al. 2009, Nature G; Canadell et al. 2007, PNAS
Global estimates of tropical forest fluxes 2000-2007 IPCC 2007 estimates of Land Use Change emissions =1.1 GtC y-1 [range = 0.3 – 2.8] Pan et al (2011): Net tropical source: 1.3 0.7 GtC y-1 • Emissions: 2.9 0.5 GtC y-1 • Regrowth: 1.6 0.5 GtC y-1 Transcom (atmospheric inversion): net tropical source =1.1 0.9 GtC y-1 Estimated degradation flux = 5% to 130% of the deforestation flux depending on region.
Uncertainty in emissions from humid tropics Emissions from Humid Tropical Deforestation
Carbon consequences from disturbance Carbon emitted = 0.5 x A x B x E B = Mean biomass of deforested area A = Area deforested E = Emission efficiency
Carbon consequences from disturbance Carbon emitted = 0.5 x A x B x E B = Mean biomass of deforested area A = Area deforested E = Emission efficiency
REDD+ www.redd-monitor.org van Noordwijk, 2009 • “The Copenhagen talks on climate change … may be remembered as a time when the world concluded that it must protect forests, and pay for them”. • The Economist, 18-Dec-09 • “Forest plan gets the ax at UN climate talks” • AP, 19-Dec-09
REDD+ UNFCCC Decision 1.1 (COP-17, Cancun): encourages developing country Parties to contribute to mitigation actions in the forest sector by: • reducing emissions from deforestation; • reducing emissions from forest degradation; • conservation of forest carbon stocks; • sustainable management of forests; • enhancement of forest carbon stocks.
If the UNFCCC does deliver a REDD+ agreement, it will look roughly like: • A voluntary, results-based scheme, part of wider mitigation actions by developing countries, funded by developed countries / “markets”. • Limited to: REDD; and conservation, sustainable management of forests and enhancement of forest carbon stocks. (Excludes agriculture, includes reforestation, SFM) • • Phased, so countries receive support for: • Capacity building, national planning • Implementing policy reform and monitoring • Actual reduction in emissions • • Safeguards are voluntary (local people, governance, biodiversity), but does exclude plantations • To do: • Targets on finance/mitigation • National approach • MRV
Meanwhile in the real world: • Brazilian deforestation rate lowest since 80s
Objectives Deforestation mapping in the humid tropics • Deforestation mapping with HH ScanSAR: can onset of events be detected? • Deforestation mapping with dual polarisation: better than ScanSAR? Is HV better than HH? • Deforestation mapping with combined ScanSAR & polarisation: does this give better results?
Data Coverage WWF databases Forest types: Red = dry, green = swampy. Deforestation is shown in pink & light blue
Detection of deforestation with PALSAR 2007 2008 R = HH; G =HV; B = HV/HH
Conclusions • Deforestation does not leave a distinctive signature in ScanSAR data. • ScanSAR performance is greatly affected by large changes in backscatter in natural forest, especially swamp forest, due to variations in surface water under the forest. Deforestation detection and false alarm rates are different in dry and swamp forest. • Using polarisation helps: using HH & HV (FBD data) together gave a detection rate of 64% for a false alarm rate of 20%. • Combining ScanSAR and polarisation yields detection rates of 72% for a false alarm rate of 20%.
Deforestation and forest degradation in dry tropical woodlands
ALOS estimates of biomass, Tier 1 to Tier 2 calculations (Ryan et al., 2012) Central Mozambique, area of 6700 km2 Tier 1: values for deforestation rate and mean biomass from literature: Emission estimates from 74 to 604 kt C y-1 Tier 2: using local estimates of biomass: Emission estimates from 60 to180 kt C y-1 Tier 2+: biomass change estimated using PALSAR, calibrated against in situ data: Emissions = 580 ± 775 kt C y-1
Conclusions • L-band spaceborne data gives access to biomass, biomass change and forest degradation in low biomass forests. This includes dry tropical forests, which are increasingly subject to human disturbance and are a largely unquantified source of carbon emissions. • There are no L-band sensors in space. • L-band cannot measure beyond around 80-100 tons per ha of biomass