Download
1 / 8
80 likes | 183 Vues
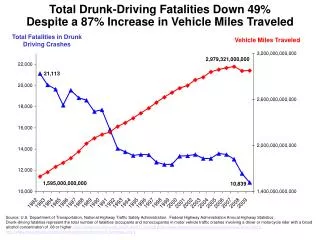
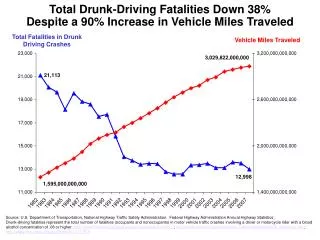
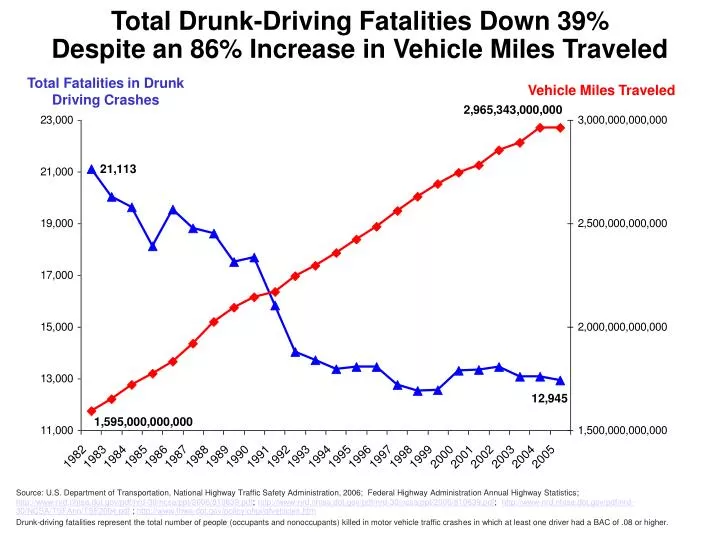
Total Drunk-Driving Fatalities Down 39% Despite an 86% Increase in Vehicle Miles Traveled. Total Fatalities in Drunk Driving Crashes. Vehicle Miles Traveled.

E N D
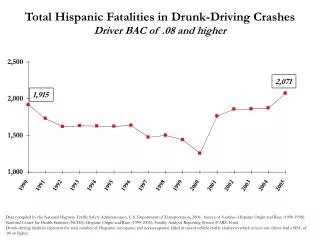
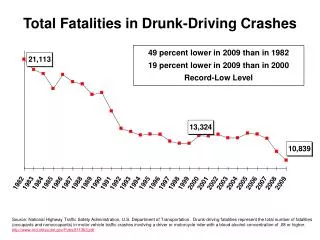
Total Drunk-Driving Fatalities Down 39% Despite an 86% Increase in Vehicle Miles Traveled Total Fatalities in Drunk Driving Crashes Vehicle Miles Traveled Source: U.S. Department of Transportation, National Highway Traffic Safety Administration, 2006; Federal Highway Administration Annual Highway Statistics; http://www-nrd.nhtsa.dot.gov/pdf/nrd-30/ncsa/ppt/2006/810639.pdf; http://www-nrd.nhtsa.dot.gov/pdf/nrd-30/ncsa/ppt/2006/810639.pdf; http://www-nrd.nhtsa.dot.gov/pdf/nrd-30/NCSA/TSFAnn/TSF2004.pdf ; http://www.fhwa.dot.gov/policy/ohpi/qfvehicles.htm Drunk-driving fatalities represent the total number of people (occupants and nonoccupants) killed in motor vehicle traffic crashes in which at least one driver had a BAC of .08 or higher.
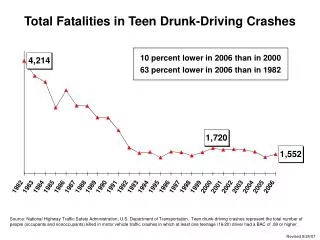
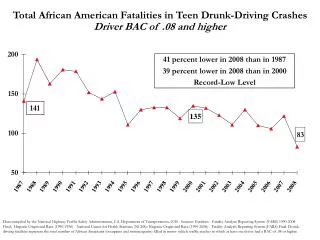
Total Drunk-Driving Fatalities Per Billion Vehicle Miles Traveled 10 percent lower in 2005 than in 2000 67 percent lower in 2005 than in 1982 Record-Low Level Source: U.S. Department of Transportation, National Highway Traffic Safety Administration, 2006; Federal Highway Administration Annual Highway Statistics; http://www-nrd.nhtsa.dot.gov/pdf/nrd-30/ncsa/ppt/2006/810639.pdf; http://www-nrd.nhtsa.dot.gov/pdf/nrd-30/NCSA/TSFAnn/TSF2004.pdf ; http://www.fhwa.dot.gov/policy/ohpi/qfvehicles.htm Drunk-driving fatalities represent the total number of people (occupants and nonoccupants) killed in motor vehicle traffic crashes in which at least one driver had a BAC of .08 or higher.
Total Drunk-Driving Fatalities Down 39% Despite a 61% Increase in Registered Motor Vehicles Registered Motor Vehicles Total Fatalities in Drunk Driving Crashes Source: U.S. Department of Transportation, National Highway Traffic Safety Administration, 2006; Federal Highway Administration Annual Highway Statistics; http://www-nrd.nhtsa.dot.gov/pdf/nrd-30/ncsa/ppt/2006/810639.pdf; http://www-nrd.nhtsa.dot.gov/pdf/nrd-30/NCSA/TSFAnn/TSF2004.pdf ; http://www.fhwa.dot.gov/policy/ohpi/qfvehicles.htm Drunk-driving fatalities represent the total number of people (occupants and nonoccupants) killed in motor vehicle traffic crashes in which at least one driver had a BAC of .08 or higher.
Total Drunk-Driving Fatalities Per Million Registered Motor Vehicles 62 percent decline since 1982 Record-Low Level Source: U.S. Department of Transportation, National Highway Traffic Safety Administration, 2006; Federal Highway Administration Annual Highway Statistics; http://www-nrd.nhtsa.dot.gov/pdf/nrd-30/ncsa/ppt/2006/810639.pdf; http://www-nrd.nhtsa.dot.gov/pdf/nrd-30/NCSA/TSFAnn/TSF2004.pdf ; http://www.fhwa.dot.gov/policy/ohpi/qfvehicles.htm Drunk-driving fatalities represent the total number of people (occupants and nonoccupants) killed in motor vehicle traffic crashes in which at least one driver had a BAC of .08 or higher.
Total Drunk-Driving Fatalities Down 39% Despite a 32% Increase in Licensed Drivers Total Fatalities in Drunk Driving Crashes Licensed Drivers Source: U.S. Department of Transportation, National Highway Traffic Safety Administration, 2006; Federal Highway Administration, U.S. Department of Transportation, 2005; http://www-nrd.nhtsa.dot.gov/pdf/nrd-30/NCSA/TSFAnn/2003HTMLTSF/TSF2003.htm; http://www.fhwa.dot.gov/policy/ohim/hs04/htm/dl1c.htm Drunk-driving fatalities represent the total number of people (occupants and nonoccupants) killed in motor vehicle traffic crashes in which at least one driver had a BAC of .08 or higher.
Total Drunk-Driving Fatalities Per Million Licensed Drivers 53 percent decline since 1982 Record-Low Level Source: U.S. Department of Transportation, National Highway Traffic Safety Administration, 2006; Federal Highway Administration, U.S. Department of Transportation, 2005; http://www-nrd.nhtsa.dot.gov/pdf/nrd-30/NCSA/TSFAnn/2003HTMLTSF/TSF2003.htm Drunk-driving fatalities represent the total number of people (occupants and nonoccupants) killed in motor vehicle traffic crashes in which at least one driver had a BAC of .08 or higher.
Total Drunk-Driving Fatalities Down 39% Despite a 28% Increase in Total U.S. Population Total Fatalities in Drunk Driving Crashes Total U.S. Population Source: U.S. Department of Transportation, National Highway Traffic Safety Administration, 2006; Census Bureau estimates, release date December 22, 2005 http://www-nrd.nhtsa.dot.gov/pdf/nrd-30/ncsa/ppt/2006/810639.pdf; http://www-nrd.nhtsa.dot.gov/pdf/nrd-30/NCSA/TSFAnn/TSF2004.pdf ; Drunk-driving fatalities represent the total number of people (occupants and nonoccupants) killed in motor vehicle traffic crashes in which at least one driver had a BAC of .08 or higher.
Total Drunk-Driving Fatalities Per Million Population 52 percent decline since 1982 Record-Low Level Source: U.S. Department of Transportation, National Highway Traffic Safety Administration, 2006; Census Bureau estimates, release date December 22, 2005 http://www-nrd.nhtsa.dot.gov/pdf/nrd-30/ncsa/ppt/2006/810639.pdf; http://www-nrd.nhtsa.dot.gov/pdf/nrd-30/NCSA/TSFAnn/TSF2004.pdf ; Drunk-driving fatalities represent the total number of people (occupants and nonoccupants) killed in motor vehicle traffic crashes in which at least one driver had a BAC of .08 or higher.