1 / 1

Relative abundance %

Relative abundance %.

luce
Télécharger la présentation

Relative abundance %

An Image/Link below is provided (as is) to download presentation Download Policy: Content on the Website is provided to you AS IS for your information and personal use and may not be sold / licensed / shared on other websites without getting consent from its author. Content is provided to you AS IS for your information and personal use only. Download presentation by click this link. While downloading, if for some reason you are not able to download a presentation, the publisher may have deleted the file from their server. During download, if you can't get a presentation, the file might be deleted by the publisher.

E N D

Presentation Transcript


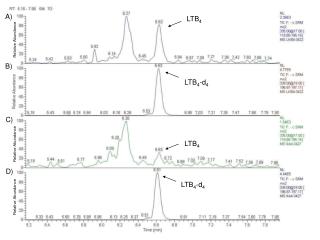
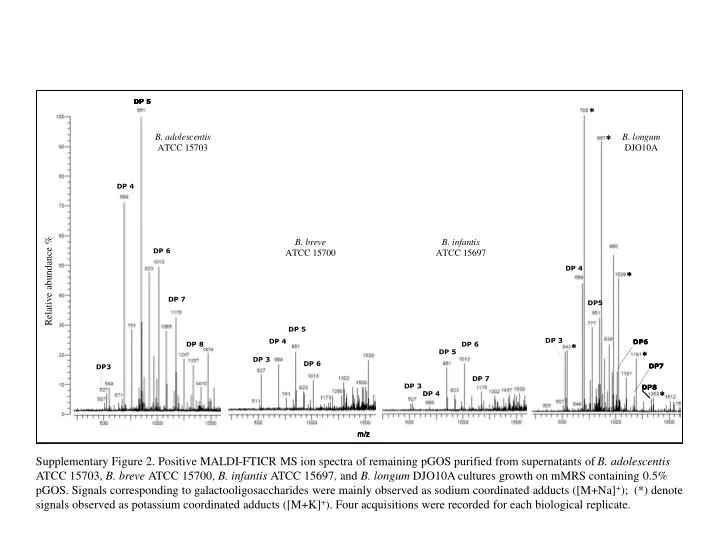
  1. Relative abundance % Supplementary Figure 2. Positive MALDI-FTICR MS ion spectra of remaining pGOS purified from supernatants of B. adolescentis ATCC 15703, B. breve ATCC 15700, B. infantis ATCC 15697, and B. longum DJO10A cultures growth on mMRS containing 0.5% pGOS. Signals corresponding to galactooligosaccharides were mainly observed as sodium coordinated adducts ([M+Na]+); (*) denote signals observed as potassium coordinated adducts ([M+K]+). Four acquisitions were recorded for each biological replicate.

More Related