Download
1 / 13
130 likes | 361 Vues
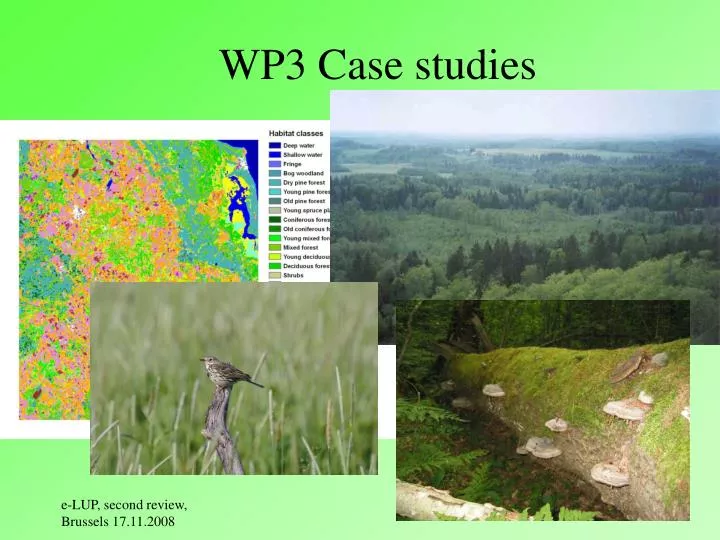
WP3 Case studies. Why Case studies?. Case studies can: illustrate regional differences and sustainability conditions – sustainability profiles, (b) demonstrate the issues and above all mechanisms of impacts at relevant spatial scale(s),

E N D
Why Case studies? • Case studies can: • illustrate regional differences and sustainability conditions – sustainability profiles, • (b) demonstrate the issues and above all mechanisms of impacts at relevant spatial scale(s), • (c) can demonstrate interplay of assessment-policy-research, i.e explore the scientific underpinnings of IA • should feed back into the chapter, • (e) observe the different user pathways of the tool.
Integration WP2 Methodology Tools Chapters Models Case studies
Case study 1 Forest structure and yield Ecosystem,vegetation + soil described in detail, in forest stands under the same dominant tree species and growth conditions, but far apart geographically • Shows the type of data needed to model forest growth and carbon sinks, not innovative by itself, but: • Portrays the variability in vegetation due to biogeographical, human impact and local features – need to separate pollution and eutrophication (N deposition) effects on vegetation from biogeographical and local effects • Integrated with the ’Forest-forestry-carbon sink’ chapterby providing real data • Links to the MODEL flash: PUME forest growth model, which describes and extrapolates growth and stand dynamics >WP4
Case study 2. Air pollution • Unique pollution gradient across Europe-Russia for a whole range of pollutants, First data of this quality for Russia. • New, policy-relevant data on methyl-mercury and POP’s on a wide spatial scale, including pairwise comparison of urban and background levels • Admittedly, limited sampling, but calibrated to expert labs with previous large datasets in Europe for each pollutant. • The data collected: • published in a top scientific journal • Integrated into the Air pollution and climate change chapter (4), linked with Pan-European policies and monitoring • Also stand alone as a case study • Linked with MODEL flashes Magic and Ecosense (acidification resp. health effects)
Case study 2. Air pollution • SIA-relevance of conclusions made – as stated in the beginning, cases should feedback into the chapters • Sulphur and e.g heavy metal deposition has decreased, but N deposition is still very high, resulting in continued acidification and eutrophication.Relevance to climate change policy. • Results very clearly indicate reason for concern about N in EU-area. Nutritional disbalance in the Netherlands? • High deposition of pollutants regionally in EU-area, but rather restricted to urban sites in Russia. Long-range transport relevance. Important to realize: ’clean rural areas’ is a nonsensical concept in parts of Western Europe! • Major marine source for methyl mercury – large variation in background levels. Relevance to monitoring programmes. • Role of wetlands as sources/accumulators of methylmercury. Take away for management: even with present zero-tolerance to mercury emissions, there is a huge storage in soil, which can be mobilized by land use • Results show recent POP pollution in Russian near-urban areas – the need • for regulation
Case study 3. Habitat fragmentation and biodiversity loss and Case study 4. Modelling bird diversity and habitats Tenet:While conservation of biological diversity has progressed in leaps and bound via the Habitat and Bird Directive, the decline of biological diversity has continued, mainly due to the lack of implementation of landscape-level tools built on integrating specific conservation targets in sectoral policy making Goal:To show how landscape pattern models can be used in policy making in forestry and agriculturein a sustainable development setting where researchers, landowners and policy makers are acting together on conservation of biological diversity
Case study 3 and 4. Biological diversity Data collected • In six landscape areas covering Europe and Russia: • Landscape pattern described (relevance to MCPFE) • Inventory of habitat quality – dead wood (relevance to MCPFE) • Inventory of biological diversity using polypore diversity as an indicator (relevance to SEBI 2010) • There have been no previous studies where rigorous data of this type has been collected across a Eurasian gradient, or even on a cross-country basis. • In the Latvian landscape area: • Landscape pattern described on a detailed level (relevance to MCPFE and agroenvironment policy) • Inventory of songbirds, including the EU bird indicator species
Case study 3 and 4 Biological diversity Data analysis Fragmentation metrics calculated – presently in state of infancy in MCPFE reporting Quality of habitat in relation of biological diversity – shows what can be done with SEBI indicators and MCPFE data Estimation of threseholds of biodiversity loss using metapopulation models – without knowing threseholds, the policy maker can not make decisions on targets (a nebulous “halt biodiversity decline by 2010 is not enough)
Case study 3 and 4 Biological diversityData analysis • Habitat models derived for 30 songbird species, including the EU indicator bird species. (Not previously done for all possible songbirds in one area) • Habitat models derived for farmland and forest specialist bird richness (not previously done in any study). • Effect of artificial landscape model patterns on bird diversity and bird populations examined (not previously done in any study). • Monitoring of the continuing decline of bird diversity is not enough. This must be linked with landscape pattern, to direct policy on specific bird popluation and landscape targets.
Case study 3 FLASH Models in ecological management Biodiversity Chapter E-tool Case study 4
E-tool • To achieve a win scenario for biological diversity in SIA: • Knowledge of the habitat requirements for the relevant focal species in the region • Decided targets for populations of focal species • Decided landscape targets (eg. habitat quality, agricultural practice, coverage, land-use change) If this knowledge is lacking, fill in a loser for biological diversity