Download
1 / 19
200 likes | 379 Vues
Modeling Long-Term Soil Organic Carbon Dynamics as Affected by Management and Water Erosion. RC Izaurralde, JR Williams, WM Post, AM Thomson, WB McGill, LB Owens, and R Lal 3 rd USDA Symposium on Greenhouse Gases Carbon Sequestration in Agriculture and Forestry March 21-24, 2005

E N D
Modeling Long-Term Soil Organic Carbon Dynamics as Affected by Management and Water Erosion RC Izaurralde, JR Williams, WM Post, AM Thomson, WB McGill, LB Owens, and R Lal 3rd USDA Symposium on Greenhouse Gases CarbonSequestration in Agriculture and Forestry March 21-24, 2005 Baltimore, MD
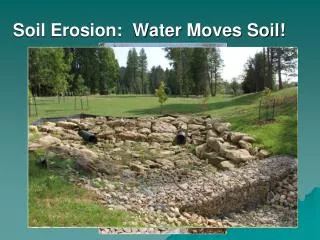
The soil C balance is determined by the difference between C inputs and outputs • Inputs: • Litter • Roots • Organic amendments • Sedimentation • Outputs: • Soil respiration • Dissolved Organic C (DOC) • Erosion
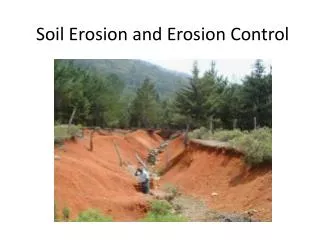
Background • The impacts of erosion-deposition processes on the carbon cycle are not well known • Eroded C, source or sink of atmospheric C? Date: 3/4/1972Photographer: Eniz E. RowlandLocation: Whitman County, 6 miles East of Pullman, WashingtonWatershed: South Palouse SWCD-25 USDA - Natural Resources Conservation Services
Two hypotheses • Hypothesis 1: Soil erosion leads to aggregate breakdown making physically-protected C accessible to oxidation (Lal, 1995) • 1.14 x 10¹⁵ g C y-1 • Hypothesis 2: Buried C during erosion-sedimentation is replaced by newly fixed pedogenic C and may lead to a significant C sink (Stallard, 1998) • 0.6 – 1.5 x 10¹⁵ g C y-1
Objectives • Review literature to determine the extent to which empirical evidence supports either the sequestration or increased accessibility hypothesis in managed ecosystems • Present modeling results of three long-term experiments documenting changes in soil and eroded C as affected by management and water erosion
Global estimates of water erosion, CO2 flux to atmosphere, and sediment transport to oceans (Lal, 1995) • Soil displacement by water erosion: • 190 x 1015 g y-1 • 5.7 x 10¹⁵ g C y-1 • CO2 flux from displaced sediments: • 1.14 x 10¹⁵ g C y-1 • Sediment transport to oceans: • 19 x 1015 g y-1 • 0.57 x 10¹⁵ g C y-1 Rio de la Plata, the muddy estuary of the Paraná and Uruguay Rivers delivers huge amounts of DOC and POC to the Atlantic Ocean. http://earth.jsc.nasa.gov/debrief/Iss008/topFiles/ISS008-E-5983.htm
Linking terrestrial sedimentation to the carbon cycle • Stallard (1998) examined two hypotheses: • Accelerated erosion and modifications of hydrologic systems lead to additional C burial during deposition of sediments • Buried C is replaced by newly fixed C at sites of erosion or deposition • Results of a latitudinal model across 864 scenarios (wetlands, alluviation + colluviation, eutrophication, soil C replacement, wetland NEP and CH4) suggested a human-induced C sink of 0.6 – 1.5 x 10¹⁵ g C y-1
Further studies on the links of erosion-sedimentation processes and the C cycle • Harden et al. (1999) • Sampled disturbed and undisturbed loess soils in Mississippi • Used C and N data to parameterize Century for different erosion and tillage histories • Found that soil erosion amplifies C loss and recovery • 100% of soil C lost during 127 y • 30% of C lost was replaced after 1950 • Liu et al. (2003) • Developed Erosion-Deposition-Carbon-Model (EDCM) to simulate rainfall erosion and deposition effects on soil organic C • Applied EDCM to Nelson Farm watershed in Mississippi • Concluded that soil erosion and deposition reduced CO2 emissions from the soil to the atmosphere
Integrating soil and biological processes at landscape scale through simulation modeling • EPIC is a process-based model built to describe climate-soil-management interactions at point or small watershed scales • Crops, grasses, trees • Up to 100 plants • Up to 12 plant species together • Key processes simulated • Weather • Plant growth • Light use efficiency, PAR • CO2 fertilization effect • Plant stress • Erosion by wind and water • Hydrology • Soil temperature and heat flow • Carbon, Nitrogen, and Phosphorus cycling • Tillage • Plant environment control: fertilizers, irrigation, pesticides • Pesticide fate • Economics EPIC Model Solar irradiance Precipitation Wind Plant growth Operations Erosion Runoff Soil layers Pesticide fate C, N, & P cycling Representative EPIC modules Williams (1995) Izaurralde et al. (in review)
Simulating soil C erosion at the North Appalachian Experimental Station at Coshocton, OH • Entire watershed divided into small bermed sub-catchments with separate treatments • Treatments start in 1939; modified in the 1970s W128 W118 W188
Land-use history for watersheds W128, W188, and W118 W128 W188 W118
Temporal dynamics of surface runoff in W118 • Average runoff (mm) • Observed: 63.1±9.3 mm • Simulated: 74.6±11.1 mm
Temporal dynamics of soil sediment in W118 Detail of Coshocton wheel • Soil sediment (Mg ha-1) • Observed: 1.18±0.51 Mg ha-1 • Simulated: 0.95±0.53 Mg ha-1 OBS = 0.949SIM + 0.241 R2 = 0.98**
Observed and simulated sediment C collected in W118 during 1951-1999 • Sediment C (Mg C ha-1 y-1) • Observed: 0.031±0.014 Mg C ha-1 y-1 • Simulated: 0.047±0.024 Mg C ha-1 y-1 OBS = 0.562SIM + 0.005 R2 = 0.97**
Dry corn yields under conventional and no till No till = 7.40±0.23 Mg ha-1 Conv. till = 7.34±0.25 Mg ha-1
Observed and simulated corn yields at 15.5% moisture under no till (W188) Obs. = 8.28±0.31 Mg ha-1 Sim. = 8.73±0.27 Mg ha-1
Observed and simulated soil C after 36 years of conventional and no till Data: Puget et al. (2005)
A comparison of annual rates of soil C erosion (Mg C ha-1 y-1) measured or estimated in NAEW watersheds. Data for W118 are from Hao et al. (2001)
Summary • The simulation results-supported by the data- suggest that the cropping systems studied lose and redistribute over the landscape between 50 and 80 kg C ha-1 y-1 due to erosive processes • Although the simulation results presented do not answer directly the two prevailing hypotheses, they do provide insight as to the importance of erosion-deposition processes in the carbon cycle at landscape, regional and global scales • In future work, we will utilize APEX, the landscape version of EPIC, to study the role of erosion and deposition as sources or sinks of atmospheric C