Download

1 / 12
120 likes | 224 Vues
A Tutorial on Gathering Information through a DAQ and outputting it to Excel. By Morgan Muren. Setting up the Anemometer through the DAQ. Connect the two terminals from the anemometer to ai0 + and – on the DAQ. Connect the DAQ to your computers USB port. Run LabVIEW.

E N D
A Tutorial on Gathering Information through a DAQ and outputting it to Excel By Morgan Muren
Setting up the Anemometer through the DAQ • Connect the two terminals from the anemometer to ai0 + and – on the DAQ. • Connect the DAQ to your computers USB port. • Run LabVIEW
Setting up a VI in LabVIEW • Select VI from Template • Select Data Acquisition with NI-DAQmx.vi • Once open Double click on the DAQ Assistant VI to configure it.
Setting up the DAQ • Select Analog Input, then Resistance. • Select the port you have the device connected to. (ai0 for this tutorial)
Setting Up the Front Panel • Switch to Front Panel • On the controls panel, click on Express, then Graph Indicators, then click and drag the Graph icon onto the work space.
Setting up Block View • Switch to Block View • Connect the newly formed Waveform Graph to the data port on the DAQ Assistant. • Right click on open space, go to File I/O, then Write Measurement File.
Setting up Writing to Excel • Select where you want to save the .lvm file. • Make sure to check No headers button under Segment Headers. • Make sure to check One column only under X Value Columns.
Collecting the Data • Connect the signals port on Write To Measurement File to the data port on DAQ Assistant. • Switch to Front Panel, spin up anemometer and hit Go arrow.
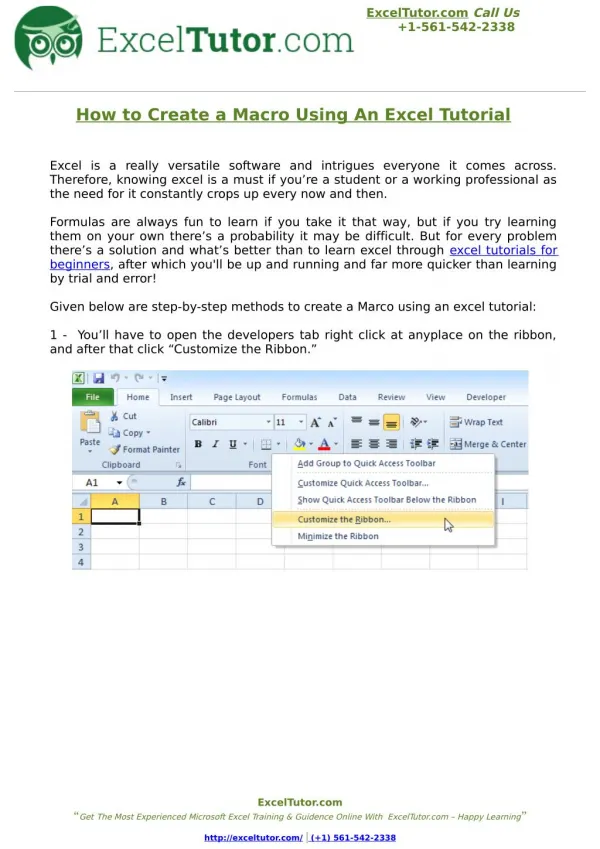
Opening .lvm file in Excel • Find where you saved the .lvm file, right click on hit and select open. • On the windows message screen, click the program from a list button and then select Microsoft Office Excel from the list.
Displaying in Excel • Highlight the two columns. • Go to insert, select line graph. • -note- The previous works for Excel 2007, in Excel 2003 highlight both columns, then select chart wizard, then line graph.
The Final Product • Now you should see your newly created waveform graph. From here you can manipulate the graph as you see fit by right clicking on it and selecting properties.