1 / 1

Declining Annual Event Rates

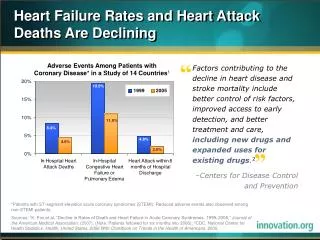
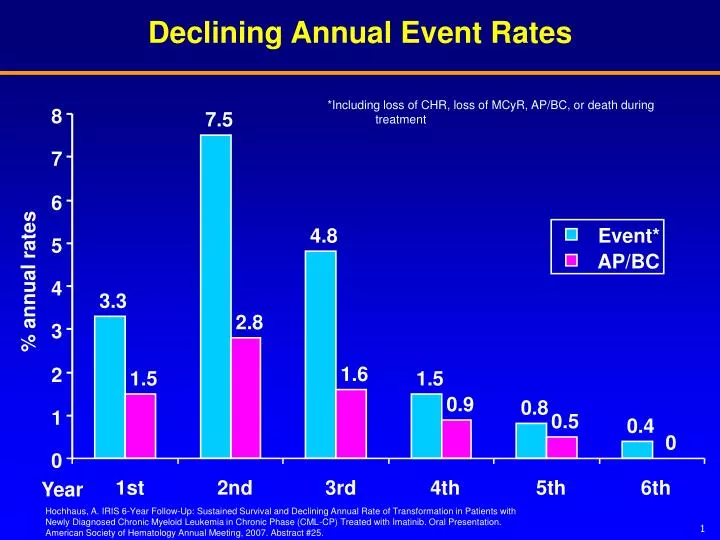
Declining Annual Event Rates. *Including loss of CHR, loss of MCyR, AP/BC, or death during treatment. 8. 7.5. 7. 6. 4.8. Event*. 5. AP/BC. % annual rates. 4. 3.3. 2.8. 3. 1.6. 2. 1.5. 1.5. 0.9. 0.8. 1. 0.5. 0.4. 0. 0. Year. 1st. 2nd. 3rd. 4th. 5th. 6th.

lucio
Télécharger la présentation

Declining Annual Event Rates

An Image/Link below is provided (as is) to download presentation Download Policy: Content on the Website is provided to you AS IS for your information and personal use and may not be sold / licensed / shared on other websites without getting consent from its author. Content is provided to you AS IS for your information and personal use only. Download presentation by click this link. While downloading, if for some reason you are not able to download a presentation, the publisher may have deleted the file from their server. During download, if you can't get a presentation, the file might be deleted by the publisher.

E N D

Presentation Transcript


  1. Declining Annual Event Rates *Including loss of CHR, loss of MCyR, AP/BC, or death during treatment 8 7.5 7 6 4.8 Event* 5 AP/BC % annual rates 4 3.3 2.8 3 1.6 2 1.5 1.5 0.9 0.8 1 0.5 0.4 0 0 Year 1st 2nd 3rd 4th 5th 6th

More Related