Download
1 / 35
350 likes | 510 Vues
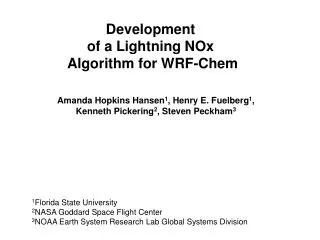
Development of a Lightning NOx Algorithm for WRF-Chem. Amanda Hopkins Hansen Department of Meteorology Florida State University ahopkins@met.fsu.edu Advisor: Henry E. Fuelberg Florida State University. OUTLINE. 1. What is Lightning NOx (LNOx)? 2. Rationale - why is LNOx important

E N D
Development of a Lightning NOx Algorithm for WRF-Chem Amanda Hopkins Hansen Department of Meteorology Florida State University ahopkins@met.fsu.edu Advisor: Henry E. Fuelberg Florida State University
OUTLINE • 1. What is Lightning NOx (LNOx)? • 2. Rationale - why is LNOx important • Lightning Parameterization • Previous Research • FSU LNOx Research Plan-necessary ingredients • 4. Validation
O2 N2 N2 N2 N2 N2 O2 N2 O2 O2 N2 N2 • High temps and pressure Break up N2 and O2 • As the hot channel cools from the outside in, • NO is produced • the rate of cooling determines concentration • NO2 produced during the return stroke N2 Air is ~78%N2 and ~21% O2 N2 + O2 NO + NO Zel’dovich mechanism (Zel-dovich and Raizer 1966)
Rationale - why is LNOx important June, July, and August 1. Lightning is an important source of NOx in the relatively clean upper troposphere December, January, and February Pressure (hPa) Zonal Mean Lightning NOx production (10-2kg/s) From the NASA GISS GCM Hopkins, 2003
Rationale - why is LNOx important • 2. LNOx indirectly affects our local air quality and global climate • Has a strong influence on Ozone (O3) and hydroxyl • radical (OH) concentration NOx [NO+NO2]: • is a primary pollutant found in photochemical smog • is a precursor for tropospheric ozone formation TROPOSPHERIC OZONE: • is the third most important greenhouse • gas • impacts the Earth’s radiation budget and • can cause changes in atmospheric • circulation patterns. • is toxic to humans, plants and animals. Photo courtesy of University of California at Berkley
Global NOx Budget 3. LNOx is difficult to realistically model, but is Important in the global budget of NOx Figures from Global Emissions Inventory Activity data sets Note: lightning figures are calculated by model internally
LNOx algorithm for WRF-Chem with Parameterized Convection what are the necessary ingredients? • Flash rate parameterization • 2) Average NO production per flash • 3) Method of specifying the vertical distribution • of LNOx emissions
Schemes often used for Flash Rate Production 1. Cloud Top Height [Price and Rind, 1992; Michalon et al., 1999] 2. Convective Precipitation Rate [Meijer et al., 2001; Allen and Pickering, 2002] Separate parameterizations are needed to simulate land and oceanic lightning 3. Upward Cloud Mass Flux/Updraft Velocity [Grewe et al., 2001; Allen and Pickering, 2002] • This scheme cannot be developed based on observations. Model output must be used. Therefore, the relationship between these variables and flashrate will be model-dependent. None of these schemes yield global flash distributions that compare well with satellite flash observations. What is needed is a more microphysically-based scheme. Possibilities include the schemes by Deierling et al. (2005) and Futyan and Del Genio (2007).
Flux Hypothesis Deierling et al., 2005 They propose that lightning frequency, f, is proportional to the product of the precipitation rate, p, and the mass upflux of ice crystals, Fi. The charging mechanism used in the this study involves rebounding collisions between heavy graupel pellets and the lighter ice crystals . This scheme would work very well on the cloud-scale We need a Regional scale relationship!!! After Saunders et al. 1993
Convective Radar Storm Height Futyan and Del Genio, 2007 Cloud top height may be several kilometers higher than the height of significant radar signal fifth order power law for radar top height (above surface) second order for radar top height above 0 degree isotherm.
LNOx algorithm for WRF-Chem what are the necessary ingredients? Lightning Flash Rate Parameterization • Flash rate (F) may be calculated based on the following relationship: • F=AHn • Relationship between Radar storm height above the freezing level • and LDAR data is needed to determine A and n above. • Radar Reflectivity calculated within WRFChem using hydrometeors • from microphysical scheme (WSM6) coupled with the Kain-Fritsch • cumulus parameterization. • Convective storm height (H) is found using the 20dbz contour and the • freezing level is obtained from the WRF temperature field.
WSR-88 Doppler Radar and the Lightning Detection and Ranging (LDAR) data Futyan and Del Genio (2007) used TRMM data for their research: we will use Doppler radar and LDAR data to form a relationship between flash rate and radar storm height. 3-D Lightning Mapping locations Kennedy Space Center, Florida** - LDAR/Vaisala Huntsville, Alabama – NM Tech Dallas, Texas – LDAR/Vaisala Washington D.C. – NM Tech **We will start with KSC
WSR-88 Doppler Radar and the Lightning Detection and Ranging (LDAR ) data from Kennedy Space Center (KSC) Doppler Radar Melbourne, Florida KSC LDAR. Sensor 0 is the central LDAR receiver. (After Poehler and Lennon 1979 and Vollmer 2002)
WSR-88 Doppler Radar and the Lightning Detection and Ranging (LDAR ) data from Kennedy Space Center (KSC) The location of the Melbourne, Florida National Weather Service Office WSR-88D radar in relation to the Kennedy Space Center. Range rings are provided at 10 km intervals. (After Nelson 2002).
LDAR Flash Algorithm Created by Nelson (2002), and used recently by Stano (2007) Turns “sparks” into flashes • warm season months of May through September 1997-2005 For a spark to be included in a flash it has to meet Temporal and Spatial Constraints: occurs within 3 s of the first observed spark each successive spark of a flash had to be within 0.5 s of the previous spark. occurs within the ellipse it is included in the flash. LDAR is 97% accurate out to 100km And 99% accurate to 25km. (Applied Meteorology Unit 1996) Nelson 2002
WDSS: Warning Decision Support System This will provide a way to visualize lightning flashes with radar reflectivity The image depicts individual Lightning Detection and Ranging (LDAR) sparks as measured by the Kennedy Space Center LDAR network, the cloud-to ground strikes measured by the National Lightning Detection Network (NLDN), and quality controlled reflectivity data from the Melbourne NWS radar. From the LDAR sparks we can calculate flash rate.
WDSS: Warning Decision Support System Cross section view of cell 49 in previous slide
Composite Radar Reflectivity • from KMLB for 3 Aug 2005 • Black contours are LDAR flash • counts in the corresponding • 6 minute radar scan • Red rings are distance (km) from • KMLB radar located: • Lat=28.109 • Lon=-80.650 • LDAR central receiver location: • Lat=28.5386 • Lon=-80.6431
Cross section through approx • 28.4N Radar Reflectivity • from KMLB for 3 Aug 2005 • Black contours are LDAR flash • counts in the corresponding • 6 minute radar scan
LNOx algorithm for WRF-Chem Flash rate (F) may be calculated based on the following relationship: F=AHn Relationship between Radar storm height above the freezing level and LDAR data is needed to determine A and n above. The plot below shows a relationship between WSR88D radar storm height And LDAR flash rate on 1km2 bins Log linear plot here NOTE: FS07 plot has been normalized over TRMM scan time and 300km2 This is a much larger area than mine and a much longer time scale
LNOx algorithm for WRF-Chem what are the necessary ingredients? Lightning Flash Rate Parameterization • Flash rate (F) may be calculated based on the following relationship: • F=AHn • Relationship between Radar storm height above the freezing level • and LDAR data is needed to determine A and n above. • Radar Reflectivity calculated within WRFChem using hydrometeors • from microphysical scheme (WSM6) coupled with the Kain-Fritsch • cumulus parameterization. • Convective storm height (H) is found using the 20dbz contour and the • freezing level is obtained from the WRF temperature field.
LNOx algorithm for WRF-Chem what are the necessary ingredients? LNOx parameterization • Production rate of NO from both IC and CG lightning: • -500 moles per flash (Ott et al.,in progress) • Vertical Distribution of NO: • Pickering et al., 1998: -Wind fields from Goddard Cumulus • Ensemble (GCE) model were used to redistribute LNOx throughout • the duration of the storm. Profiles were constructed for mid-latitude • continental, tropical continental, and tropical marine regimes • based on profiles computed for individual storms in each regime
WRF-Chem “Online” Chemical Model • Consistent: all transport done by meteorology model • *Same vertical and horizontal coordinates (no horizontal and vertical interpolation) • *Same physics parameterization for subgrid scale • *No interpolation in time • Easy Data Handling • Makes computation time faster
Directly involved in major WRF-Chem development NOAA/ESRL Georg Grell, Steven Peckham, Stuart McKeen PNNL Jerome Fast, Bill Gustafson, Rahul A. Zaveri, James C. Barnard NCAR Bill Skamarock Rainer Schmitz (University of Chile – Santiago, Chile) Marc Salzmann (Max Planck Institute for Chemistry – Mainz, Germany) And Many more national and international collaborators About 250 registered users
WRF-Chem Structure http://ruc.fsl.noaa.gov/wrf/WG11/wrf_wksp_2007_minitutorial/02_totorial.wrf-chem.Peckham.pdf
WRF-Chem Emissions • Based on the EPA’s 1999 National Emissions • Inventory version 3 • 4km gridded data set • Considered an interim data set until updates can be made • No biogenic sources of VOC, NOx, nor fire-related emissions
WRF-Chem V2.2 Chemistry • Chemical mechanisms: • RADM2, Carbon Bond (CBMZ) • Photolysis (coupled with hydrometeors and aerosols): • Madronich, Fast-j (coupled to aerosols and microphysics) • Deposition: • Dry deposition (coupled with soil/veg scheme, “flux-resistance” analogy) • Simplified wet deposition by convective parameterization Biogenic emissions: • Guenther – online calculation based on USGS landuse, T and radiation • BEISv3.11 (modify reference fields produced from complex landuse data)
Additions in WRF/Chem V2.2 • Kinetic PreProcessor (KPP), MPI Mainz • Improved convective (non-resolved) transport, coupling of convective parameterization with atmospheric and photolysis radiation (ESRL/GSD) • Non-resolved and resolved aqueous phase chemistry, wet deposition, (NOAA/ARL/EPA, PNNL,ESRL/GSD) • 2-way nesting (PNNL, ESRL/GSD) • Cloud-aerosol interaction (indirect effect) with Lin et al. 6-class microphysics scheme (PNNL) • Lateral boundary conditions from global models (U of Chile, ESRL/GSD) • Urban parameterizations (NCAR, coming soon Spain) • Positive definite advection (NCAR) • NMM and ARW dynamic cores (ESRL/GSD) • Offline version for the ARW core (to be released shortly, C-DAC, India and ESRL/GSD))
WRF-Chem Physics Microphysics-WSM6 Cumulus Parameterization-Kain Fritsch Long wave & Short wave radiation- Planetary Boundary Layer-Mellor-Yamada-Janjic (MYJ) Surface Layer Land-surface parameterization Lightning module will be included in WRF-Chem physics directory
Comparison with 350 Ozone monitors during ICARTT/NEAQS experiment – 8hr peak Evaluation period: July 12 – July 31, 2004 Continuous model improvement over the last 2 years
Verification Simulations for Summer 2004 INTEX-NA period over eastern US and comparisons with aircraft data DC-8 flight track showing the path through the Huntsville, AL storms We have the same data for Kennedy Space Center Plot courtesy of Mike Porter
Verification satellite
Verification ozonesondes
Summary • Flash rate parameterization being developed for WRF-Chem usingobserved radar and 3-D lightning mapping array data. • WRF-Chem will first be tested with the Futyan and Del Genio (2007) relationship and then with the newly developed scheme. • Existing NO production per flash and vertical distribution information will be used. • Testing of WRF-Chem with lightning will be conducted using aircraft NOx observations from the ICARTT (NASA and NOAA data) experiment from Summer 2004, ozonesondes, and possibly NO2 from • satellite.