Download
1 / 81
830 likes | 964 Vues
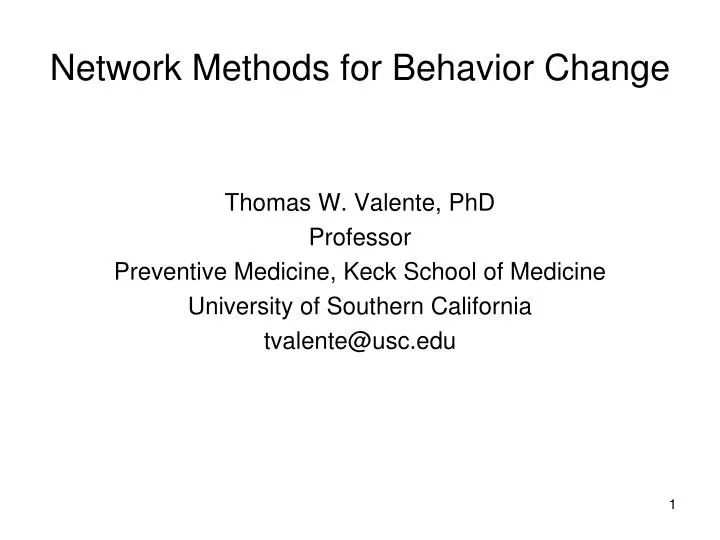
Network Methods for Behavior Change. Thomas W. Valente, PhD Professor Preventive Medicine, Keck School of Medicine University of Southern California tvalente@usc.edu. Interventions: Definitions. Using network data to change behaviors Change individual and community/organizational level

E N D
Network Methods for Behavior Change Thomas W. Valente, PhD Professor Preventive Medicine, Keck School of Medicine University of Southern California tvalente@usc.edu
Interventions: Definitions Using network data to change behaviors Change individual and community/organizational level Not exactly clear what constitutes a network intervention, for now: Any change program that uses network data to: Select change agents Define groups Affect network structure Assist Behavior Change program implementation 2
Theory Will Guide The type of change desired will be guided by theory In some cases want to increase cohesion in others increase fragmentation Increase/decrease centralization E.g., slowing spread of STDs requires different strategy than accelerating adoption of office automation
6 Types of Network Interventions Identify opinion leaders or key players to act as change agents Create network-based groups/positions Identify leaders within groups or match leaders to groups Snowballing / Contact tracing / Respondent Driven Sampling Rewire Networks More/less cohesive More/less centralized More/less dense Change core-peripheriness Etc. Other: Triadic Structures Identify low threshold adopters Reaching critical mass Reporting back to group/dialogue Others?
1. Opinion Leaders The most typical network intervention Easy to measure Intuitively appealing Proven effectiveness Over 20 studies using network data to identify OLs and hundreds of others using other OL identification techniques
Diffusion Network Simulation w/ 3 Initial Adopter Conditions
HIV Sexual Risk Reduction Social Network Intervention Trials in Eastern Europe HIV sexual risk reduction behavior interventions within indigenous friendship-based social networks in Eastern Europe - J.A. Kelly, Ph.D. and Y.A. Amirkhanian, Ph.D. (CAIR). Social networks of Roma ethnic minority and of young MSM were identified, recruited, assessed to identify sociometric leader of each network, and then randomized into either immediate or delayed intervention condition. The leaders of the intervention networks attended 9-session training program and carried out HIV prevention conversations with their own network members. Intervention outcomes were compared between experimental and control groups at Baseline, 3- and 12-months.
Roma Egocentric Network HIV Prevention Trial, Sofia, Bulgaria (N=255, 52 networks, retention>90%)Kelly, Amirkhanian, Kabakchieva et al., BMJ, 2006
Young MSM Egocentric Network HIV Prevention Trial, Bulgaria/Russia (n=276, 52 networks, retention >84%) Amirkhanian, Kelly, Kabakchieva et al., AIDS, 2005 * 12-month p indicates significance in difference between Bulgaria and Russia: The long-term effects remained strong in Bulgaria.
Achievable in UCINET Do not symmetrize data Compare degree scores with other centrality measures Compare degree scores with Key Player analysis
Other Centrality Measures In-degree preferable, easy Theoretical diffusion processes may suggest other centrality measures, closeness, betweenness Can use other measures as tie-breakers (i.e., 2 nodes of same in-degree choose one with higher closeness)
Sophisticated World Use different types of opinion leaders at different stages: In-degree Betweenness Closeness Use different types of opinion leaders for different groups: In-degree in highly cohesive groups Betweenness in fractured groups
FREEMAN'S DEGREE CENTRALITY MEASURES ---------------------------------------------------------------------- Diagonal valid? NO Model: ASYMMETRIC Input dataset: C:\MISC\DIFFNET\OL\com18 1 2 3 4 OutDegree InDegree NrmOutDeg NrmInDeg ------------ ------------ ------------ ------------ 19 26 5.000 2.000 13.889 5.556 20 27 5.000 7.000 13.889 19.444 3 11 5.000 5.000 13.889 13.889 4 12 5.000 6.000 13.889 16.667 5 13 5.000 6.000 13.889 16.667 6 14 5.000 7.000 13.889 19.444 25 31 5.000 7.000 13.889 19.444 8 16 5.000 6.000 13.889 16.667 9 17 5.000 8.000 13.889 22.222 10 18 5.000 1.000 13.889 2.778 11 19 5.000 3.000 13.889 8.333 12 2 5.000 2.000 13.889 5.556 13 20 5.000 1.000 13.889 2.778 14 21 5.000 11.000 13.889 30.556 15 22 5.000 4.000 13.889 11.111 34 6 5.000 5.000 13.889 13.889 17 24 5.000 6.000 13.889 16.667 . . .
10 Methods Used to Identify Peer Opinion Leaders (Valente & Pumpuang, 2007)
Implementation Issues Do you just turn leaders loose? Schedule 1-1 between leaders & members Have leaders give formal presentations Have leaders call a meeting Allow leaders to decide how to promote change Continuum of Passive to Active OL Involvement
2. Network Based Groups Sets of people/nodes that are densely connected Groups can reinforce (or inhibit) the behavior change process Behavior change may be appropriate for groups Finding groups
Defining Groups Components Cliques/Kplexes/Cycles, etc. Newman-Girvan algorithm Provides mutually exclusive groups Provides measure of group fit Ken Frank at MSU has group programs Can also use positional analysis such as CONCOR to identify equivalent positions
Implementation Issues Do groups need to be the same size? In school based programs, usually they do In organizations they can vary somewhat but then group size becomes an issue Does the socio-demographic composition of the group matter? Most cases groups will be homogenous Some cases may need to impose homogeneity on the group (sex education, e.g.)
Positions rather than Groups Positions may be more relevant than groups Hierarchical position may be relevant (e.g., supervisors versus line staff) Positions may identify hierarchy and clustering at the same time Issues for group implementations are similar to those for positions
Do groups need leaders? May be sufficient to let groups determine leaders or leadership preference Behavior change issue is controversial Behavior change process is controversial May be preferred to impose some leadership structure Behavior change process is accepted Goals are well-defined
3. Match Leaders to Groups Rather than have leaders unattached, assign them to people who think they are leaders Leadership is local Emphasizes homophily between leaders and members Builds on naturally occurring networks Leaders can be more effective if assigned to those who nominate them
Borgatti’s Key Player Program Nodes of high in degree may overlap and so just selecting on in-degree may not be helpful Borgatti’s Key player program avoids this problem somewhat, but it does not directly (yet) indicate specifically who covers whom (who is connected to whom)
Key Player Results Baseline Fragmentation = 0.000 Baseline Heterogeneity = 0.000 Initial set (based on betweenness) is: 20 12 22 Fit of initial set = 213.000 Round 1, 2 iterations. Fit = 783.000 Round 2, 1 iterations. Fit = 213.000 Round 3, 1 iterations. Fit = 213.000 Round 4, 2 iterations. Fit = 503.000 Round 5, 3 iterations. Fit = 783.000 Round 6, 2 iterations. Fit = 783.000 Round 7, 2 iterations. Fit = 783.000 Round 8, 1 iterations. Fit = 213.000 Round 9, 1 iterations. Fit = 213.000 Round 10, 1 iterations. Fit = 213.000 Key players are: 12. 2 16. 23 20. 27 Fragmentation = 0.158 Heterogeneity = 0.156
The Effects of a Social Network Method for Group Assignment Strategies on Peer Led Tobacco Prevention Programs in Schools Thomas W. Valente, PhD Beth R. Hoffman, MPH Anamara Ritt-Olson, MA Kara Lichtman, MA C. Anderson Johnson, PhD Am. J. of Public Health Funded by NCI/NIDA, Transdisciplinary Tobacco Use Research Center
Opinion Leaders Individuals Receive the Most Nominations Data from Coleman et al. 1966
Networked Condition Sociogram based on ties Optimal leader/learner matching
Tobacco Use Prevention Among Adolescents in Culturally Diverse California
TTURC IRP Project Test of a Culturally Tailored Tobacco Prevention Curriculum Two curricula created and implemented in 16 middle schools Compared against 8 control schools CHIPS – standard social influences program FLAVOR – culturally tailored Data collected in 6th, 7th and 8th grades
Objectives • Evaluate the feasibility of a network method for identifying leaders and creating workgroups for school-based tobacco prevention curriculum. • Nested within a study of FLAVOR, a culturally tailored program, being compared to CHIPS! a standard social influences curriculum. • Determine whether more effective than random groups and teacher defined ones.
FIRST NAME LAST NAME ROSTER NUMBER 1 2 3 4 5 Who are the five BEST LEADERS in this class? Think about the five people in this class who would make the best leaders for working on group projects. Write up to 5 names on the lines below, starting with the best leader on the first line. After you write their name look at the list of names on the roster that has been provided. Match the name to the number and write the number in the boxes. If you can’t think of five names in this class, then leave the extra lines blank. You can name yourself if you want. Also asked who are your five best friends
Regression Results on Post Program Appeal (Lower Scores Better) (N=1961; k=84; Beta Coefficients)
Regression Results on Post Program Attitudes (Lower Scores Better, Beta Coefficients)
Classroom Level Analysis (N=k=84; Beta Coefficients)
1-Year Change in Smoking by Curricula & Implementation Condition
AORs for Curricula & Implementation Condition on 1-Year Change in Smoking Regression controls for age, gender, ethnicity, parent foreign born, parent education, SAS, parental smoking, and scholastic achievement
Results Summary Network condition was most appealing reduced pro-tobacco attitudes reduced susceptibility Network effect was dependent on curriculum
TND Network How would a network condition compare to an existing evidence-based program? TND is a tobacco and drug use prevention curriculum tested in multiple setting. Created TND Network designed to be TND plus interactivity and network method for leader and group definitions.
TND Network Background TND – evidence based program for reducing substance abuse among adolescents in school. TND Network – modified TND to be more interactive, led by trained peer opinion leaders. Objectives Determine whether TND Network was effective at reducing current use Would it create deviancy training? 48
Study Design 14 Continuation High Schools Recruited for the Study Baseline Survey Administered (N=938) Pre-test Surveys 75 Classes Randomized 28 Control 22 TND Regular 25 TND Networked 1 Year Surveys (N=541) 49
Associations (β Coefficients) for Study Conditions on Current Substance Use 50