1 / 2

PC1

lucius
Télécharger la présentation

PC1

An Image/Link below is provided (as is) to download presentation Download Policy: Content on the Website is provided to you AS IS for your information and personal use and may not be sold / licensed / shared on other websites without getting consent from its author. Content is provided to you AS IS for your information and personal use only. Download presentation by click this link. While downloading, if for some reason you are not able to download a presentation, the publisher may have deleted the file from their server. During download, if you can't get a presentation, the file might be deleted by the publisher.

E N D

Presentation Transcript


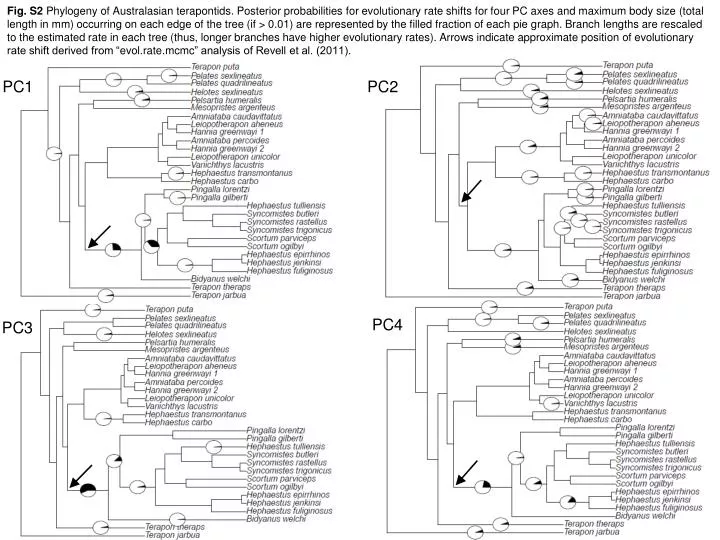
  1. Fig. S2 Phylogeny of Australasian terapontids. Posterior probabilities for evolutionary rate shifts for four PC axes and maximum body size (total length in mm) occurring on each edge of the tree (if > 0.01) are represented by the filled fraction of each pie graph. Branch lengths are rescaled to the estimated rate in each tree (thus, longer branches have higher evolutionary rates). Arrows indicate approximate position of evolutionary rate shift derived from “evol.rate.mcmc” analysis of Revell et al. (2011). PC1 PC2 PC4 PC3

  2. TL

More Related