Download
1 / 14
140 likes | 294 Vues
By: Madison Kerr and Nina Zimmerman. The 1906 World Series: How the better team lost. Background. 16 MLB teams: 8 in the National League 8 in the American League White Sox Won World Series 4 – 2 1906 - Cubs Set Record – 116 Wins “Hitless Wonders”. Comparisons. Batting Average

E N D
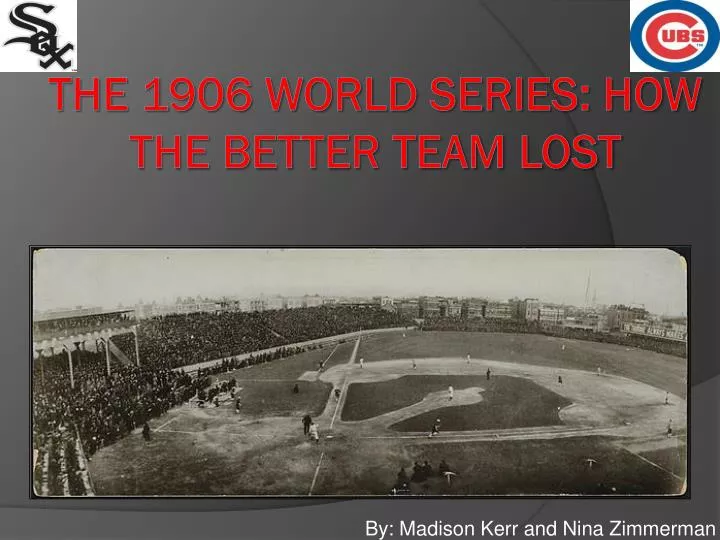
By: Madison Kerr and Nina Zimmerman The 1906 World Series: How the better team lost
Background • 16 MLB teams: 8 in the National League 8 in the American League • White Sox Won World Series 4 – 2 • 1906 - Cubs Set Record – 116 Wins • “Hitless Wonders”
Comparisons • Batting Average • On Base Percentage • Slugging Percentage • On Base Plus Slugging • Earned Run Average • Strikeout to Walk Ratio • Box Plots and Z-Scores
Batting Average Mean: 0.246 Cubs Mean: 0.262 Sox Mean: 0.230 St. Deviation: 0.0141 Cubs z-score: 1.08 Sox z-score: -1.116
On Base Percentage Mean: 0.306 Cubs Mean: 0.328 Sox Mean: 0.301 St. Deviation: 0.0169 Cubs z-score: 1.289 Sox z-score: -0.307
Slugging Percentage Mean: 0.314 Cubs Mean: 0.339 Sox Mean: 0.286 St. Deviation: 0.0203 Cubs z-score: 1.233 Sox z-score: -1.381
On Base Percentage Plus Slugging Percentage Mean: 0.620 Cubs Mean: 0.667 Sox Mean: 0.588 St. Deviation: 0.0345 Cub z-score: 1.358 Sox z-score: -0.0322
Earned Run Average Mean: 2.661 Cubs Mean: 1.75 Sox Mean: 2.13 St. Deviation: 0.486 Cubs z-score: -1.875 Sox z-score: -1.0926
Strikeout to Walk Ratio Mean: 1.5 Cubs Mean: 1.57 Sox Mean: 2.13 St. Deviation: 0.323 Cubs z-score: 0.217 Sox z-score: 1.953
Winning Percentage Cubs : 116/155 = 74.83% White Sox : 93/154 = 60.39%
Case Study: Series ERA vs. Season ERA Cubs Season Mean: 1.735 Cubs Season SD: 0.719 Sox Season Mean: 1.948 Sox Season SD: 0.340 Cubs Series Mean: 3.428 Cubs Series SD: 1.600 Sox Series Mean: 1.989 Sox Series SD: 0.600
Conclusion • White Sox: • Outperformed Cubs in World Series • Better ERA = Better Pitching = World Series Champs
Websites Used • http://www.vintageball.com/1906_Burke_Sox.jpg • http://www.baseball-reference.com/postseason/1906_WS.shtml • http://farm3.static.flickr.com/2327/2350721370_5229972740_z.jpg?zz=1 • http://www.baseball-reference.com/leagues/MLB/1906.shtml