Download
1 / 102
1.04k likes | 1.22k Vues
Covalent Bonding / Molecular Structure / Introduction to Organic Chemistry and the Alkanes. H ACP Chemistry / Organic Unit 4. Objectives #13-14 Phase Changes and Phase Diagrams. Objectives #13-14 Phase Changes and Phase Diagrams. *Important Parts of a Heating/Cooling Curve

E N D
Covalent Bonding / Molecular Structure / Introduction to Organic Chemistry and the Alkanes H ACP Chemistry / Organic Unit 4
Objectives #13-14 Phase Changes and Phase Diagrams *Important Parts of a Heating/Cooling Curve (see curve in lecture guide) A. Specific heat of solid added (endothermic) B. Specific heat of liquid added (endothermic) • Specific heat of gas added (endothermic) • Melting (heat of fusion added) (endothermic) • Freezing (heat of solidification released) (exothermic) • Boiling (heat of vaporization added) (endothermic) • Condensing (heat of condensation released) (exothermic) (graph interpretation practice)
Objectives #13-14 Phase Changes and Phase Diagrams *where the graph is increasing or decreasing, specific heat is being added or subtracted (which results in the temperature changing) *where the graph is not changing, a phase change is occurring and these is no change in the temperature of the substance *key equations: to change temperature: Q =mc∆t to change phase: ∆H = moles of material X molar heat of phase change (examples)
Example I: Calculate the energy change involved to convert 1 mole of ice at -25oC to steam at 125oC. (analysis of steps involved)
Example I Step IV: boil ΔH = (1 mole) (40.67 kJ/mole) = 40.67 kJ Step V: 100C > 125C Q = (18.0 g) (1.84 J/gC) (25C) = 828 J = .828 kJ Total = 56.0 kJ
Example II Step I: 140C > 100C Q = (100.0 g) (1.84J/gC) (40C) = -7360 J = -7.360 kJ Step II: condensation ΔH = (100.0 g/18.0 g) (40.67 kJ/mol) = -225.9 kJ Step III: 100C > 0C Q = (100.0 g) (4.18 J/gC) (100C) = -41800 J = -41.8 kJ
Example II Step IV: freeze ΔH = (100.0 g/18.0 g) (6.01 kJ/mole) = -33.4 kJ Step V: 0C > -30C Q = (100.0 g) (2.09 J/gC) (30C) = -6270 J = -6.27 kJ Total = -315 kJ
Objectives #13-14 Phase Changes and Phase Diagrams *Interpreting Phase Diagrams *a phase diagram allows one to determine the phase that a substance is in at a given temperature and pressure *the phase diagram only shows one substance in its various phases *a typical phase diagram: (see diagram in lecture guide and next slide)
Objectives #13-14 Phase Changes and Phase Diagrams *Interpreting Phase Diagrams *a phase diagram allows one to determine the phase that a substance is in at a given temperature and pressure *the phase diagram only shows one substance in its various phases *a typical phase diagram: (see diagram in lecture guide)
Objectives #13-14 Phase Changes and Phase Diagrams *the following lines on the graph represent phase change boundaries:
Objectives #13-14 Phase Changes and Phase Diagram(practice worksheets) *some general relationships and observations to note: *if the solid-liquid line curves to the right with increasing pressure, then the melting point is also increasing (this is the norm) *if the solid-liquid line curves to the left with increasing pressure, then the melting point is decreasing (this is not the norm; water follows this pattern)
Objectives #15-17 Structure of Solids, Properties and Applications *solids come in two general types: crystalline or amorphous *crystalline solids contain particles arranged in a well-defined pattern called a crystal lattice with flat faces and definite angles; examples include NaCl or diamonds *amorphous solids lack any well defined structure; examples include wax, rubber, or glass *the crystal lattice of a crystalline solid, which is a three dimensional array showing the location of individual particles, is actually made up of many repeating individual parts called the unit cell; for example the repeating pattern on wall paper *the simplest common type of unit cell is the cubic unit cell where all sides are equal in length and consist of all 90o angles
Objectives #15-17 Structure of Solids, Properties and Applications *the three types of cubic unit cells are: primitive or simple cubic – lattice points only occur at the corners of unit cell body-centered cubic – lattice points occur at the corners and in the center face-centered cubic – lattice points occur at the corners and faces
Objectives #15-17 Structure of Solids, Properties and Applications *except for the atom in the center of the body-centered cubic unit cell, all of the atoms located at the lattice points are actually shared to various degrees by other unit cells; in order to determine the net number of atoms in a unit cell and thus its chemical formula, one must know the fraction of an atom that occurs in each position of the unit cell as follows:
Objectives #15-17 Structure of Solids, Properties and Applications
Example of Face Centered Unit Cell in Sodium Chloride (green = Cl; blue = Na)
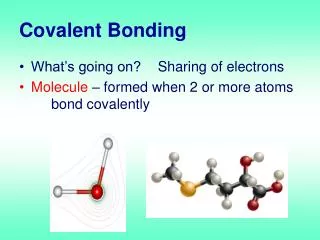
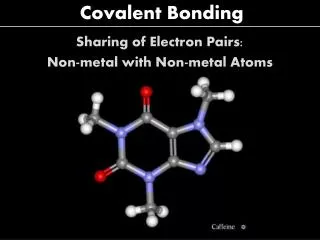
Objectives #1-4 Covalent Bonding and Lewis Structures *formation of a covalent bond: *in ionic bonding, the bonding mechanism comes about through the electrostatic attraction between valence electrons and atomic nuclei as atoms strive to achieve the stable electron arrangements of noble gases *these attractive forces result in substances usually having rigid structures, high melting points, and varying degrees of electrical conductivity *many compounds, including those within the realm of organic chemistry, lack a rigid structure, have low melting points, vaporize easily, and are generally poor conductors (demo) *these compounds complete their octets through the sharing of electrons in a covalent bond
Objectives #15-17 Structure of Solids, Properties and Applications (examples) Example #1: Determine the number of sodium and chloride ions in the NaCl unit cell using the diagram on the screen as a guide. For Na: 12 edges X 1/4 each = 3 Na ions 1 ion Na at the center = 1 Na ion For Cl: 6 faces X ½ each = 3 Cl ions 8 corners X 1/8 each = 1 Cl ion 4 Na ions to 4 Cl ions; NaCl
Example #2 The element iron crystallizes in a form called alpha iron, which has a body centered unit cell. How many iron atoms are in the unit cell? 1 Fe atom at center 8 corners X 1/8 each = 1 Fe atom results in 2 iron atoms
X-Ray Crystallography *the layers of atoms in the crystal lattice acts as an effective diffraction grating that can be used to scatter a beam of x-rays *the diffraction, or scattering, of the x-rays produces a characteristic pattern of light and dark areas on a x-ray detector *by examining the areas of light and dark and measuring the angles of deflection, the original crystal structure of the material can be deduced *this analytical technique has been used to determine the structure of DNA and other molecular crystals
Objectives #15-17 Structure of Solids, Properties and Applications*Types of Bonding in Solids and their Influence on Properties
Objectives #15-17 Structure of Solids, Properties and Applications*Types of Bonding in Solids and their Influence on Properties
Objectives #1-4 Covalent Bonding and Lewis Structures *formation of a covalent bond: *in ionic bonding, the bonding mechanism comes about through the electrostatic attraction between valence electrons and atomic nuclei as atoms strive to achieve the stable electron arrangements of noble gases *these attractive forces result in substances usually having rigid structures, high melting points, and varying degrees of electrical conductivity *many compounds, including those within the realm of organic chemistry, lack a rigid structure, have low melting points, vaporize easily, and are generally poor conductors (demo) *these compounds complete their octets through the sharing of electrons in a covalent bond
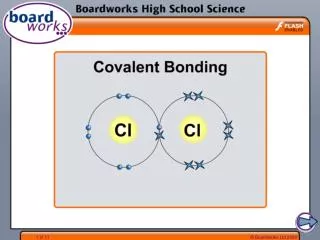
Objectives #1-4 Covalent Bonding and Lewis Structures *initially when two nonmetals approach each other, they repel each other due to the negative charges of their respective electron clouds and the positive charges of their respective nuclei; due to this situation the potentialenergy of the separate atoms is too high for a stable bond to form *however at an optimum distance between the nuclei, the electron clouds of the two atoms overlap and the valence electrons are concentrated between the two nuclei involved; energy is released in this process and a stable bond can now form between the two atoms (diagram)
Illustration of Energy for Formation of Hydrogen Molecule vs. Atomic Distances
Drawing Lewis Structures / Structural Formulas / Condensed Structural Formulas / Molecular Line Drawings *examples of Lewis Structures: *examples of structural formulas: *examples of condensed structural formulas: *examples of molecular line drawings:
Objectives #5-7 Electronegativity / Formal Charge / Bond Length / Bond Energy *electronegativity and polarity: *when electrons are shared in a covalent bond the degree of electron sharing by the nuclei of the atoms involved is based on the electronegativity values of the atoms in the bond *electronegativity is a measure of the ability of an atom to attract electrons to itself; electronegativity generally decreases down a group on the periodic table and increases across the period *elements are assigned electronegativity values that range from .7 through 4 *electronegativity value differences can be used to predict the most likely type of bond that will form between two atoms; nonpolar covalent, polar covalent, or ionic *the approximate difference ranges for each type of bonding are as follows: 0-.3 nonpolar .4-1.9 polar 2.0 › ionic
Objectives #5-7 Electronegativity / Formal Charge / Bond Length / Bond Energy *the greater the electronegativity difference between two elements, the more polar the bond is expected to be (examples) B-Cl C-Cl P-F P-Cl *since the electrons are not shared equally in a polar bond, regions of negative and positive charge, dipoles, are established *dipoles can be indicated by placing a partial positive charge (ς+) on the atom with the lower electronegativity value and a partial negative charge (ς-) on the atom with the higher electronegativity value; dipoles can also be indicated by drawing an arrow from the lower electronegative atom to the higher electronegative atom (examples) H – F H - F
Objectives #5-7 Electronegativity / Formal Charge / Bond Length / Bond Energy *Formal Charge *in many cases, when drawing Lewis structures more than one structure can be drawn to satisfy the octet rule *the concept of formal charge can be used to determine which structure representation is the most stable *in order to calculate the formal charge on an atom, the following procedure is used: • All unshared (nonbonding) electrons are assigned to the atom on which they are found • For any bond – single, double, or triple – half of the bonding electrons are assigned to each atom in the bond
Objectives #5-7 Electronegativity / Formal Charge / Bond Length / Bond Energy *the formal charge is then calculated by subtracting the number of electrons assigned to the atom from the number of valence electrons in the individual atom *whichever Lewis structure that results in a net formal charge that is closest to zero or results in having the negative charge reside on the more electronegative atom would be the most reasonable to use
(examples of formal charge calculations) • Determine the formal charges on the CN-1 ion. [:C=N:]-1 For carbon: 2 nonbondedelectrons assigned to C 3 bonded electrons (1/2 of 6 in the triple bond) assigned to C Total assigned: 5 Total 4 on neutral carbon atom: 4 Formal charge = 4-5 = -1
For nitrogen: 2 nonbonded electrons assigned to N 3 bonded electrons (1/2 of 6 in the triple bond) assigned to N Total assigned: 5 Total valence on neutral nitrogen atom: 5 Formal Charge = 5-5 = 0
The net overall formal charge for the ion is -1 which equals the charge on the ion
Formal Charge Calculation for Carbon Dioxide O=C=O O-C=O Valence electrons assigned: 6,4,6 6,4,6 Nonbonding /bonding electrons assigned to atom: 4+2, 0+4, 4+2 6+1, 0+4, 2+3 Formal Charge: 0, 0, 0 -1, 0, 1 (closest to zero)
Formal Charge Calculation for the Thiocyanate Ion N-C=S N=C=S N=C-S (Val) 5,4,6 5,4,6 5,4,6 (B/N) 7, 4, 5 6, 4, 6 5, 4, 7 (FC) -2, 0, 1 -1, 0, 0 0, 0, -1 --------------------------------------------- [N=C=S]-1 is most reasonable because the neg. charge is on the most electronegative element and the sum is closest to zero
Objectives #5-7 Electronegativity / Formal Charge / Bond Length / Bond Energy *Bond Length and Bond Energy *recall that bond breaking is usually an endothermic process while bond formation is an exothermic process *a primary source of energy in our society comes from the break down of organic molecules such as methane or propane *some relationships based on “Average Bond Energies” chart: as multiple bonds (single to double to triple) increase, bond length decreases and bond energy increases this is due to the increase in the number of electron pairs present the bond energies listed are considered average values because the type of molecule that the bond belongs to can affect its energy value *to calculate the change in energy or ∆H of a reaction, one must determine the energy required to break the bonds of the reactants and the amount of energy released to form the bonds of the products