Download
1 / 39
410 likes | 606 Vues
Applications of Gravitational Lensing In X-ray Astronomy. George Chartas, Penn State University. OVERVIEW. Gravitational Lensing; Basics Applications of Gravitational Lensing in X-ray Astronomy Observing distant and faint objects via the Magnification Effect

E N D
Applications of Gravitational Lensing In X-ray Astronomy George Chartas, Penn State University 3rd INTERNATIONAL X-RAY ASTRONOMY SCHOOL
OVERVIEW • Gravitational Lensing; Basics • Applications of Gravitational Lensing in X-ray Astronomy • Observing distant and faint objects via the Magnification Effect • Imaging of AGN Accretion Disks via Microlensing • Constraining Cosmological Parameters • Future Prospects 3rd INTERNATIONAL X-RAY ASTRONOMY SCHOOL
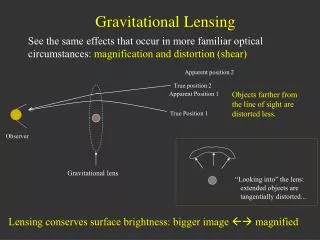
Gravitational Lensing; Basics Conceptual diagram of the gravitational deflection of light in a quad GL system. 3rd INTERNATIONAL X-RAY ASTRONOMY SCHOOL
Gravitational Lensing; Basics The two-dimensional lens equation is: The reduced deflection angle is : The position vector in the lens plane is : Thedeflection angle at position x is the sum of the deflections due to all the mass elements in the lens plane : 3rd INTERNATIONAL X-RAY ASTRONOMY SCHOOL
Gravitational Lensing; Basics Several commonly used quantities in lensing are the critical surface-mass density, Scrit , and the the Einstein Radius, RE. Multiple images are produced when the surface mass density of the lens exceeds the critical value : Scrit ~ 0.8 g cm-2 for lens and source redshifts of 0.5 and 2.0, respectively. For the special case in which the source lies exactly behind the lens (b = 0) a ring-like image is produced with a radius (commonly referred to as the Einstein Radius) qE : 3rd INTERNATIONAL X-RAY ASTRONOMY SCHOOL
Gravitational Lensing; Basics The magnification due to lensing of a point source obtains an infinite value at certain locations. These locations are called critical curves in the lens plane (upper panel) and caustics in the source plane (lower panel). The numbers in the bottom panel identify regions in the source plane that correspond to 1,3 or 5 images, respectively. Figure from J. Wambsganns, Gravitational Lensing in Astronomy, www.livingreviews.org/Articles/Volume1/1998-12wamb 3rd INTERNATIONAL X-RAY ASTRONOMY SCHOOL
Gravitational Lensing; Basics Figures from J. Wambsganns, Gravitational Lensing in Astronomy, www.livingreviews.org/Articles/Volume1/1998-12wamb 3rd INTERNATIONAL X-RAY ASTRONOMY SCHOOL
Magnified Views of Quasars • The large magnification factors of gravitationally lensed systems allow us to investigate the properties of quasars with X-ray luminosities that are substantially lower than those of unlensed ones. Magnification Factors for Several GL Quasars Object z M HE 1104-1805 2.32 9.6-9.75a B 1422+231 3.62 10b PG 1115+080 1.72 19-24c MG 0414+0534 2.64 28b RXJ0911+0551 2.8 17b APM08279+5255 3.91 50-100d A 1104 From Wisotzki et al. 1998, 339, L73 b Dai et al. 2003, in preparation c From Impey et al. 1998, ApJ, 509, 551, the range in magnification values reflects the range of lens models used to fit the data. d Egami et al. 2000 3rd INTERNATIONAL X-RAY ASTRONOMY SCHOOL
Magnified Views of Quasar Outflows 3rd INTERNATIONAL X-RAY ASTRONOMY SCHOOL
Magnified Views of Quasar Outflows • Present X-ray data for Broad Absorption Line QSOs (BALQSOs) are sparse and only poor to moderate S/N spectra are available. • X-ray faintness is likely due to absorption with NH ranging from 1022 to 1024 cm-2 (Kopko, Turnshek, & Espey 1994; Green & Mathur 1996; Gallagher et al. 1999; Mathur et al. 2000) • Their power-law continua are typical of normal quasars, with G ~ 2, and aox ranging from -1.70 to -1.44 • The flux magnification of the two BALQSOs APM08279+5255 and PG1115+080, estimated to be ~100 and ~25 in the X-ray band, and their high redshift of z = 3.91 and z = 1.72 respectively, have allowed the study of the kinematic and ionization properties of BALQSOs in the X-ray band. It is commonly accepted within the AGN community that most quasars contain high velocity winds of highly ionized gas flowing away from the central source at speeds ranging between 5,000 and 30,000 km s-1 3rd INTERNATIONAL X-RAY ASTRONOMY SCHOOL
Magnified Views of Quasar Outflows The Importance of Quasar Outflows: • Quasar outflows may distribute a significant amount of accretion-disk material into the interstellar and intergalactic medium. • Quasar outflows may be important in regulating the coeval growth of black holes and their host galaxies (e.g., Fabian 1999) • Quasar winds possibly provide a mechanism for angular momentum loss from the accretion disk • It has been proposed that quasar outflows may be a source for cosmic dust (e.g., Elvis, 2002) 3rd INTERNATIONAL X-RAY ASTRONOMY SCHOOL
Magnified Views of Quasar Outflows Unanswered Questions Regarding Quasar Outflows : (a) Is the X-ray absorption in BALQSOs due to the out-flowing wind? If so what are the kinematic properties of the X-ray absorbing medium? (b) What are the ionization properties of the X-ray absorbers (NH, n, U) and are they consistent with ionization properties of the UV absorber? (c) Is the X-ray absorber the postulated shielding gas? (d) Is the X-ray continuum from the primary source observed directly? (e) Why is there a lack of variability in the velocity structures of UV BALs?(e.g., Barlow 1993; Proga et al. 1995)Is this true for X-ray BALs? (f) Are low ionization BALQSOs quasars at an early stage in their evolution? 3rd INTERNATIONAL X-RAY ASTRONOMY SCHOOL
Magnified Views of BALQSO APM 08279+5255 Blueshifted Fe XXV Ka absorption lines (a) XMM-Newton Spectrum (b) Chandra Spectrum of APM08279+5255. We find significant variability of the X-ray BALs on rest-frame timescale of 1.8 weeks. 3rd INTERNATIONAL X-RAY ASTRONOMY SCHOOL
Magnified Views of BALQSO PG 1115+080 Blueshifted Fe XXV Ka absorption lines (a) XMM-Newton Spectrum (b) Chandra Spectrum of PG 1115+080. We place a weak constraint on variability of the X-ray BALs on rest-frame timescale of 19 weeks. 3rd INTERNATIONAL X-RAY ASTRONOMY SCHOOL
Magnified Views of BALQSOs Discussion of Spectral Results • A plausible site that may be producing the absorption features is the quasar wind. We propose that the observed high-energy absorption lines are associated with Fe K resonant absorption. • The rest energies of the most likely resonant absorption lines of Fe are: 6.70 keV (Fe XXV Ka), 7.88 keV (Fe XXV Kb), 6.97 keV (Fe XXVI Ka), 8.25 keV (Fe XXVI Kb) (Verner, D. A., Verner E. M., & Ferland, G. J., 1996, Atomic Nucl. Data) • APM 08279+5255: The 8.05+/-0.1 keV and 9.79+/-0.2 keV absorption features correspond to wind velocities of 0.20c (Fe XXV Ka), 0.15c (Fe XXVI Ka), and • 0.40c (Fe XXV Ka), 0.36c (Fe XXVI Ka), respectively. • PG1115+080 : The rest-frame energies of 7.38 keV and 9.5 keV imply • outflow velocities of about 0.1c(Fe XXV Ka), 0.04c (Fe XXVI Ka), and • 0.34c (Fe XXV Ka), 0.30c (Fe XXVI Ka), respectively. 3rd INTERNATIONAL X-RAY ASTRONOMY SCHOOL
Magnified Views of BALQSOs Discussion of Spectral Results Wind velocity as a function of radius from the central source for a radiation pressure driven wind. For a qualitative comparison we have estimated the wind velocities for launching radii of 2 x 1017 cm, 5 x 1017 cm, and 1 x 1018 cm. We have over-plotted the observed C iv BAL (dashed lines) and Fe xxv BAL (dotted lines) velocities. We have assumed Gf=100, LUV=4x1046 erg/s, LBol = 2x1047 erg/s and LBol/LEdd = 0.1. 3rd INTERNATIONAL X-RAY ASTRONOMY SCHOOL
Imaging of AGN Accretion Disks via Microlensing 3rd INTERNATIONAL X-RAY ASTRONOMY SCHOOL
Imaging of AGN Accretion Disks via Microlensing • Direct imaging of accretion disks requires angular resolutions of the order of tens of nano-seconds at z ~1. • Indirect Mapping Methods • Reverberation Mapping of BLR(Blandford & McKee 1982, Peterson 1993, Netzer & Peterson 1997) This method relies on the time lag between variations in the flux from a central source of ionizing radiation and the response of the emission lines from photoionized gas in the broad line region. (successfuly used to determine the size of the broad line region in several AGN) driver: central source of ionizing radiation, receiver: photoionized gas in the broad line region • Reverberation Mapping of the Fe Ka Emission Region(Young & Reynolds 2000) This method relies on the variation of the profiles of the Fe Ka fluorescence lines originating in the inner parts of the disk. driver: X-ray continuum source near BH, receiver: cold gas in accretion disk • Microlensing of Accretion Disk Continuum Emission(Grieger et al. 1988 and 1991; Schneider, Ehlers & Falco 1992; Gould & Gaudi 1997; Agol & Krolik 1999; Yonehara et al. 1999; Mineshige & Yonehara 1999) This method exploits the high magnification microlensing events (HMEs) in lensed quasars. During a microlensing event magnification caustics produced by stars in the lensing galaxy traverse the plane of the accretion disk and selectively magnify different emission regions. An analysis of the light-curves of microlensing events obtained in several wavelengths can be used to infer the surface brightness and inclination angle of the accretion disk. First detection of microlensing event in the Einstein Cross (Irwin et al. 1989). Limits on source size (Wambsganss et al., 1990; Wyithe, Webster , & Turner 1999 and 2000; Yonehara, 2001, Shalyapin 2001) Microlensing of the Fe Ka Emission Region (Chartas et al. 2002, Popovic et al. 2003) 3rd INTERNATIONAL X-RAY ASTRONOMY SCHOOL
Imaging of AGN Accretion Disks via Microlensing Light curves of the lensed images of QSO 2237+0305. Also shown is the light curve of the 18.14 mag reference star shifted by 1.1mag for clarity (figure obtained from the The Optical Gravitational Lensing Experiment (OGLE) monitoring of QSO 2237+0305; Udalski et al. 1999} 3rd INTERNATIONAL X-RAY ASTRONOMY SCHOOL
Imaging of AGN Accretion Disks via Microlensing Microlensing of the Fe Ka emission Region A useful scale in microlensing is the Einstein Radius : zE = [(4GMstar/c2)(DOSDLS/DOL)]1/2 Where, Mstar is the mass of the star in the lens plane and D represents the angular diameter distances. For MG J0414+0534, zlens=0.96 and zsource =2.64 we have: zE ~ 0.01(Mstar/Msolar)1/2 pc Crossing time scale : tE = zE/vt and tHME ~ cHMErs/vt Caustic of a single star plus shear. Three tracks are shown of sources crossing fold and cusp caustics. 3rd INTERNATIONAL X-RAY ASTRONOMY SCHOOL
Imaging of AGN Accretion Disks via Microlensing 3rd INTERNATIONAL X-RAY ASTRONOMY SCHOOL
Imaging of AGN Accretion Disks via Microlensing Microlensing of the Fe Ka emission Region The amplification of a point source by a fold caustic is:: A = A0 + K(x - xc)-1/2H(x - xc) where K ~ (zE/rg)1/2 and rg = GM/c2 Schematic of a caustic traversing an accretion disk. The line parallel to the y axis is the fold caustic. The disk axis points out of the page. 3rd INTERNATIONAL X-RAY ASTRONOMY SCHOOL
Imaging of AGN Accretion Disks via Microlensing The amplification of a ring-shaped emission region by a straight fold caustic as a function of the distance of the caustic from the center of the ring. 3rd INTERNATIONAL X-RAY ASTRONOMY SCHOOL
Imaging of AGN Accretion Disks via Microlensing Simulations of the evolution of the Fe Ka line profile as the caustic traverses a face-on accretion disk around a Schwarzchild black hole. xc is the distance of the caustic from the center of the accretion disk in units of gravitational radii. The caustic strength used for the simulations is K/A0 = 10rg1/2. The assumed velocity broadening of the iron line in the rest frame of the disk is sv/v = 0.01, where v is the Keplerian rotation velocity. 3rd INTERNATIONAL X-RAY ASTRONOMY SCHOOL
Imaging of AGN Accretion Disks via Fe Ka Microlensing • A candidate quasar for imaging the accretion disk via Fe Ka microlensing is MG 0414+0534. • MG J0414+0534 was discovered by Hewitt et al., 1992. zlens = 0.96 (Tonry & Kochanek, 1999), zsource = 2.64 (Lawrence, 1995) • Components of this system are exceedingly red with R-H colors of 6.8 mag for image C, 3.2 mag for the arc and 3.2 mag for the lens galaxy. • Time delays : DtA1B = 15.7 +/- 1.3 days, DtA2B = 16 +/- 1.4 days, DtCB = 66 +/- 5 days • Magnifications : MA1 ~ 12.4, MA2 ~ 14.1, MB ~ 5.1, MC ~ 1.8 (left panel) HST H band and (right panel) HST R band image of MG~J0414+0534 3rd INTERNATIONAL X-RAY ASTRONOMY SCHOOL
Imaging of AGN Accretion Disks via Fe Ka Microlensing Chandra Monitoring of MG 0414+0534 (left panel) Combined image of five Chandra observations of MG 0414+0534, (rigth panel) Deconvolved image 3rd INTERNATIONAL X-RAY ASTRONOMY SCHOOL
Imaging of AGN Accretion Disks via Fe Ka Microlensing The interval between the first detection of the Fe-K line (EW ~ 900eV) in image B (panel b) and the second DDT observation (panel d) is about 1.2 years (observed frame). The timescale of this particular microlensing event is : te ~ 2(Rs/1015 cm) years where Rs is the size of the continuum emission region. The continuum region must be Rs < 0.6x1015cm. (a) (b) Evolution of the spectrum of image B of MG J0414+0534 over 2.2 years. (c) (d) 3rd INTERNATIONAL X-RAY ASTRONOMY SCHOOL
Constraining Cosmological Parameters 3rd INTERNATIONAL X-RAY ASTRONOMY SCHOOL
Constraining Cosmological Parameters 3rd INTERNATIONAL X-RAY ASTRONOMY SCHOOL
Constraining Cosmological Parameters • With a good lens model, image positions, time delays and kinematic constraints of the lens we can estimate H0 • Alternatively, one may use an indepentently measured value of H0 (e.g., WMAP, HSTKP) to constrain the dark mater distribution of the lensing galaxy. • The main difficulty in measuring time-delays is that the brightness of each image has to be carefully monitored over several periods of the time-delay and the quasar has to show sufficient variability over time scales smaller than the time-delay. • X-ray observations of several GL quasars, show strong variability over time scales of hours to days. 3rd INTERNATIONAL X-RAY ASTRONOMY SCHOOL
Constraining Cosmological Parameters The detection of a rapid flare in a Chandra observation of RX J0911.4+0551 indicated that it was possible to measure “short” time-delays in GL systems with accuracies of a few percent and within a single observation. • RXJ0911 was first detected from the ROSAT ALL-Sky Survey (Bade et al. 1995) • RXJ0911 is a quadruply lensed quasar at z=2.8, with the lens a galaxy + cluster at z = 0.77 • Observed with Chandra on Nov 2 1999 for 29 ks • Proposed method to measure short time-delays (Chartas et al. 2001) • Estimated DtAB = 0.65h-1 days 3rd INTERNATIONAL X-RAY ASTRONOMY SCHOOL
Constraining Cosmological Parameters Measurements of short time delays in PG 1115+080 • PG1115+080 zs = 1.722 , zl = 0.311 • The source is a mini broad absorption line quasar with a OVI wind velocity of 6,000km/s • Observed with Chandra on June 2 and Nov 3 2000 for 26.8ks and 10ks respectively, and was observed with XMM-Newton on Nov 25 2001 for 62.6ks. Flux Ratios Band A1 A2 B C X-ray 3.73+/-0.12 0.85+/-0.07 1.08+/-0.06 1 HST H 4.06+/-0.17 2.56+/-0.12 0.65+/-0.04 1 HST H band (Castles) Deconvolution of Chandra 10ks image of PG1115 3rd INTERNATIONAL X-RAY ASTRONOMY SCHOOL
Constraining Cosmological Parameters DtA1A2 = 0.16 (-0.02,+0.02) days 3rd INTERNATIONAL X-RAY ASTRONOMY SCHOOL
Constraining Cosmological Parameters Light Curve of PG 1115+080 in the 0.6 - 1.7 keV band taken with the PN instrument onboard XMM-Newton XMM-Newton image of PG1115+080 field 3rd INTERNATIONAL X-RAY ASTRONOMY SCHOOL
Constraining Cosmological Parameters DtA1A2 = 0.149 +/- 0.004 days Auto-correlations (ACs) are performed to the combined XMM-Newton light-curves of all images of PG1115+080 over a range of energy bands. We plot the histogram of the AC lag times corresponding to the maxima of the AC coefficients with K-S chance probabilities of variability in each light-curve of less than 0.1 and Monte-Carlo chance probabilities of obtaining each AC coefficient of less than 0.1. 3rd INTERNATIONAL X-RAY ASTRONOMY SCHOOL
Constraining Cosmological Parameters • The values for H0 derived from present measurement of “long” time delays depend strongly on the assumed mass profiles of the lenses (e.g., Impey et al. 1998, Kochanek 2002). • Isothermal lens models predict H0 ~ 40-50km s-1 Mpc-1, • Constant M/L ratio models predict H0 ~ 60-80km s-1 Mpc-1 • The accurate X-ray measurement of the time delay DtA1A2 = 0.149 +/-0.004 in PG1115+080 was used to discriminate between mass models. • Keeton’s gravitational lensing software gravlens was used to produce a range of lens models (e.g., lens model by True & Koopmans 2002), fit these models to the observables and predict the time-delays for each model. This method results in a value of : • H0 = 67 (-8,+13) km s-1 Mpc-1 • consistent with WMAP and HSTKP results. 3rd INTERNATIONAL X-RAY ASTRONOMY SCHOOL
Future Prospects Constrain the Mass Outflow rate of Quasars Observations of gravitationally lensed BALQSOs with the next generation high-throughput X-ray telescopes (e.g., Constellation-X) will allow us to constrain the absorbing, ionization and kinematic properties of the X-ray BAL material and thus provide tighter constraint on the mass outflow rate of the wind. These observations will ultimatelly allow us to estimate the contribution of quasar outflows to the enrichment of the ISM and IGM. Image an AGN Accretion Disk via Fe Ka Microlensing The next generation high-throughput X-ray telescopes will allow us to directly probe the various emission regions of an accretion disk from scales of a few hundred gravitational radii down to the event horizon of the black hole. We expect to achieve this goal by monitoring changes in the line energy, intensity, and profile of the Fe~Ka line in gravitational lensed systems that are undergoing microlensing events. 3rd INTERNATIONAL X-RAY ASTRONOMY SCHOOL
Future Prospects Map Accretion Disk Flares in Quasars Recently Yonehara et al. 2003 proposed a method to map the locations of accretion disk flares in quasars. The technique will require observations of gravitationally lensed quasars in the X-ray band with telescopes having subarcsec resolution and collecting areas of the order of 10000 cm2. The method is based on the following equation that provides a relation between the location of flares and the difference in time delays produced by these flares.: 3rd INTERNATIONAL X-RAY ASTRONOMY SCHOOL
Chincoteague 2003 3rd INTERNATIONAL X-RAY ASTRONOMY SCHOOL