Download
1 / 20
200 likes | 333 Vues
Mean, Median, Mode Reference pages 101-105 3.1 E.Q. How do you calculate the measures of central tendency?. Mean: Add the data Divide the sum by the number of values 89+ 95+81+81+79= 425 ÷ 5= 85. Central Tendency. Find the mean: 3, 2, 1, 1, 1, 5, 3, 1, 2, 2. Central Tendency.

E N D
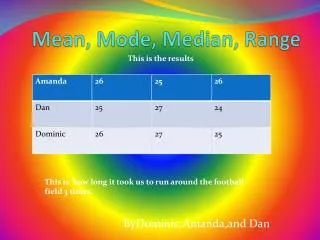
Mean, Median, Mode Reference pages 101-105 3.1 E.Q. How do you calculate the measures of central tendency?
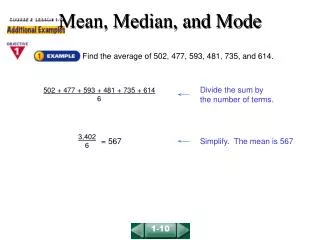
Mean: • Add the data • Divide the sum by the number of values 89+ 95+81+81+79= 425 ÷ 5= 85 Central Tendency
Find the mean: 3, 2, 1, 1, 1, 5, 3, 1, 2, 2 Central Tendency
Median: 1. Put the numbers in order. 2. Find the middle value. 3. If there are an even # of values, find the mean of the middle two. 79, 81, 81, 89, 95 Central Tendency
Find the mean: Find the median 3, 2, 1, 1, 1, 5, 3, 1, 2, 2 1 1 1 1 2 2 2 3 3 5 = 2 Central Tendency
Mode: 1. Put the numbers in order. 2. Find the number that happens the most. 79, 81, 81, 89, 95 Central Tendency
Find the mean: Find the median Find the mode 3, 2, 1, 1, 1, 5, 3, 1, 2, 2 Central Tendency
Range: Subtract the lowest value from the highest value. 95-79= Central Tendency
Find the mean: Find the median Find the mode Find the range 3, 2, 1, 1, 1, 5, 3, 1, 2, 2 Central Tendency
Russell’s homework grades are the following: 88, 96, 100, 74, 92. Russell forgot to turn in today’s assignment, so a zero is recorded for his next homework grade. How will the zero change his homework average? 1. Russell’s grade before the zero=? 2. Russell’s grade after the zero=?
E.Q. (2) How do you determine when to use mean, median, and mode to represent your data best? Reference Pages 103-104
Eldon Fig’s midterms are coming out at the end of the week. His momma will ground him if he brings home anything less than a B. Here are his grades. Does he need to save his money for a bus ticket out of town? 89, 95, 81, 81, 79 Mean: Median: Mode: Which works out better for Eldon?
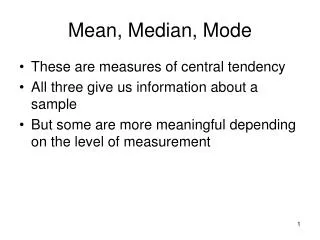
How do we know which to use when? Mean: use when there are no outliers to distort the data. Median: use when there are outliers distorting the data or to describe the middle value. Mode: use when the data are not numerical or you are choosing the most popular (fashionable) item.
Indian Trail Middle School is having a competition involving scooters, racing, and pie. Mrs. Pearce has decided the 7th grade team with the lowest average of detentions per week will get to witness the spectacle. The brilliant Bobcats have collected the following number of detentions. 16, 20, 18, 22, 22, 19, 21 What measure of central tendency best reflects the Bobcats’ behavior?
Sixteen 12-year-old girls were asked how many pairs of earrings they own. The results are below. 23, 27, 12, 20, 11, 9, 5, 10, 16, 32, 14, 31, 13, 8, 37, 32 Mean: Median: Mode: Which one better represents the data? The median is the better representative. The mean is a little higher and does not represent the smaller values as well.
Mean: Median: Mode: Which one better represents the data? The mean and median are both reasonable.
Mean: Median: Mode: Which one better represents the data? The mean and median are both reasonable.
The daily attendance at a science fair that ran for one week is listed. 145, 146, 70, 150, 151, 234, 70 Which average best represents the attendance? The median best represents the attendance for the science fair.