Download
1 / 78
850 likes | 1.52k Vues
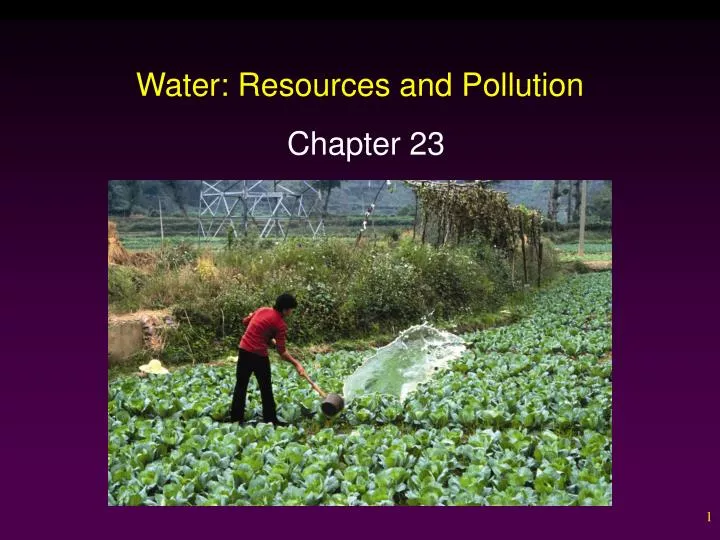
Water: Resources and Pollution. Chapter 23. Outline:. Hydrologic Cycle Water Compartments Water Availability Freshwater Shortages Increasing Water Supplies Water Management and Conservation Water Pollution Water Quality Today Water Pollution Control Water Legislation. WATER RESOURCES.

E N D
Water: Resources and Pollution Chapter 23
Outline: • Hydrologic Cycle • Water Compartments • Water Availability • Freshwater Shortages • Increasing Water Supplies • Water Management and Conservation • Water Pollution • Water Quality Today • Water Pollution Control • Water Legislation
WATER RESOURCES • Hydrologic Cycle • Describes the circulation of water as it: • Evaporates from land, water, and organisms. (Transpires from plants) • Enters the atmosphere. • Condenses and precipitates back to the earth’s surfaces. • Moves underground by infiltration or overland into rivers, lakes and seas.
MAJOR WATER COMPARTMENTS • Groundwater • Second largest reservoir of fresh water. • Infiltration - Process of water percolating through the soil and into fractures and permeable rocks. • Zone of Aeration - Upper soil layers that hold both air and water. • Zone of Saturation - Lower soil layers where all spaces are filled with water. • Water Table - Top of Zone of Sat.
Groundwater • Aquifers - Porous layers of sand, gravel, or rock lying below the water table. • Artesian - Pressurized aquifer intersects the surface. (Water flows without pumping) • Recharge Zone - Area where water infiltrates into an aquifer. • Recharge rate is often very slow. • Presently, groundwater is being removed faster than it can be replenished in many areas.
Question 1 1. Define: hydrologic cycle. • Describes the circulation of water as it: • Evaporates from land, water, and organisms. (Transpires from plants) • Enters the atmosphere. • Condenses and precipitates back to the earth’s surfaces. • Moves underground by infiltration or overland into rivers, lakes and seas.
Major Water Compartments • Rivers and Streams • Precipitation that does not evaporate or infiltrate into the ground runs off the surface, back toward the sea. • Best measure of water volume carried by a river is discharge. • The amount of water that passes a fixed point in a given amount of time. • Usually expressed as cubic feet per second.
Question 2 2. Compare and contrast: aquifer and artesian. • Aquifers - Porous layers of sand, gravel, or rock lying below the water table. • Artesian - Pressurized aquifer intersects the surface. (Water flows without pumping)
Question 3 3. What is the best way to measure the water volume of a river or stream? Does the season matter? Why? Discharge. ( example: cubic feet per second) Yes. Stream discharges usually vary over the year.
Major Water Compartments • Wetlands • Play a vital role in hydrologic cycle. • Lush plant growth stabilizes soil and retards surface runoff, allowing more aquifer infiltration. • Disturbance reduces natural water-absorbing capacity, resulting in floods and erosion in wet periods, and less water flow the rest of the year.
Major Water Compartments • The Atmosphere • Among the smallest water reservoirs. • Contains 0.001% of total water supply. • Has most rapid turnover rate. • Provides mechanism for distributing fresh water over landmasses and replenishing terrestrial reservoirs.
Question 4 4. Off the major water compartments, which has the greatest volume? The least? Greatest: the oceans Least: the atmosphere
WATER AVAILABILITY AND USE • Renewable Water Supplies • Made up of surface runoff and infiltration into accessible freshwater aquifers. • Water-Rich ad Water-Poor Countries • Water availability usually measured in per capita terms. • Highest per capita generally found in countries with moist climates and low population densities.
Water Use • Withdrawal - Total amount of water taken from a source. • Consumption - Fraction of withdrawn water made unavailable for other purposes (Not returned to its source). • Degradation - Change in water quality due to contamination making it is unsuitable for desired use.
Quantities of Water Used • Water use has been increasing twice as fast as population growth over past century. • Worldwide, agriculture claims about 70% of total water withdrawal. • In many developing countries, agricultural water use is extremely inefficient and highly consumptive. • Worldwide, industry accounts for about 25% of all water use. • Cooling water for power plants is single largest industrial use.
Question 5 • 5. State the three modes of water use and briefly describe them. • Withdrawal - Total amount of water taken from a source. • Consumption - Fraction of withdrawn water made unavailable for other purposes (Not returned to its source). • Degradation - Change in water quality due to contamination making it is unsuitable for desired use.
FRESHWATER SHORTAGES • Estimated 1.1 billion people lack access to an adequate supply of drinking water. • 2.4 billion lack acceptable sanitation. • A country where consumption exceeds more than 20% of available, renewable supply is considered vulnerable to water stress. • Globally, water supplies are abundant, but, along with capital resources, are unevenly distributed.
A Precious Resource • Currently, 45 countries, most in Africa or Middle East, cannot meet the minimum essential water requirements of their citizens. • More than two-thirds of world’s households retrieve water from outside the home. • Availability does not automatically equate to affordability. • Sanitation levels decline when water is expensive.
Depleting Groundwater • Groundwater is the source of nearly 40% of fresh water in the US. • On a local level, withdrawing water faster than it can be replenished leads to a cone of depression in the water table, • On a broader scale, heavy pumping can deplete an aquifer. • Ogallala Aquifer • Mining non-renewable resource.
Ogallala Aquifer • “The Ogallala Aquifer within the boundaries of the North Plains Groundwater Conservation District is declining at an average of 1.74 feet per year (1,082,631 acre ft).” • The aquifer is cut off from • natural recharge sources. http://www.npwd.org/Ogallala.htm
Depleting Groundwater • Withdrawing large amounts of groundwater in a small area causes porous formations to collapse, resulting in subsidence. • Sinkholes form when an underground channel or cavern collapses. • Saltwater intrusion can occur along coastlines where overuse of freshwater reservoirs draws the water table low enough to allow saltwater to intrude.
Sink Holes and Karst Topography CaCO3 + H2SO4 CaSO4 + H2O +CO2 http://www.soils.umn.edu/academics/classes/soil2125/doc/1-snkle.htm
Question 6 • 6. Compare and contrast: water table and cone of depression. • The water table is the upper surface of the zone of saturation. • On a local level, withdrawing water faster than it can be replenished leads to a cone of depression in the water table.
INCREASING WATER SUPPLIES • Seeding Clouds • Condensation Nuclei • Towing Icebergs • Cost • Desalination • Most common methods are distillation and reverse osmosis. • Three to four times more expensive than most other sources.
Flow Diagram of a reverse osmosis system (courtesy of USAID). (Kahn, 1986.) In RO, feedwater is pumped at high pressure through permeable membranes, separating salts from the water.. The feedwater is pretreated to remove particles that would clog the membranes. The quality of the water produced depends on the pressure, the concentration of salts in the feedwater, and the salt permeation constant of the membranes.” http://www.coastal.ca.gov/desalrpt/dchap1.html
New desalination technology taps waste heat from power plants • “GAINESVILLE, Fla. --- Desalination is often touted as one solution to the world's water woes, but current desalination plants tend to hog energy. Now University of Florida researchers have developed a technology that can tap waste heat from electrical power plants as its main source of energy, an advance that could significantly reduce the cost of desalination in some parts of the world.” http://www.eurekalert.org/pub_releases/2004-12/uof-ndt121604.php
Increasing Water Supplies • Dams, Reservoirs, and Canals - Trap excess water in areas of excess and transfer it to areas of deficit. • Environmental Costs • Upsets natural balance of water systems. • Ecosystem Losses • Loss of wildlife habitat. • Reservoir Size • Water Quality
Dams, Reservoirs, and Canals • Displacement of People • Three Gorges Dams in China will force relocation of over a million people. • Evaporation, Leakage, Siltation • Evaporative losses from Lake Mead and Lake Powell on the Colorado River is about 1km3 per year (264 billion gallons). • Dams slow water flow, allowing silt (nutrients) to drop out. • Loss of Free-Flowing Rivers
Question 7 • 7. Why is the energy cost so high for reverse osmotic plants? What may be a solution? • To over come the osmotic pressure of seawater ( about 30 atm) requires a higher pressure and therefore, a very high energy cost. • The waste heat from power plants may provide a cheaper alternative energy source.
Price Mechanisms and Water Policy • Throughout most of U.S. history, water policies have generally worked against conservation. • Eastern - Riparian Use Rights • Western - Prior Appropriation Rights • In most federal reclamation projects, customers have been charged only for the immediate costs of water delivery.
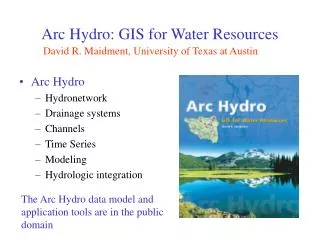
WATER MANAGEMENT AND CONSERVATION • Watershed Management • Watershed - All the land drained by a stream or river. • Retaining vegetation and ground cover helps retard rainwater and lessens downstream flooding. • Additionally, retaining crop residue on fields reduces flooding and minimizing plowing and forest cutting on steep slopes protects watersheds.
Domestic Conservation • Estimates suggest many societies could save as much as half of current domestic water usage without great sacrifice or serious change in lifestyle. • Largest domestic use is toilet flushing. • Small volume of waste in large volume of water. • Significant amounts of water can be reclaimed and recycled. • Purified sewage effluent
Infectious Agents • Main source of waterborne pathogens is untreated and improperly treated human waste. • Animal wastes from feedlots and fields is also an important source of pathogens.
Infectious Agents • In developed countries, sewage treatment plants and pollution-control devices have greatly reduced pathogens. • Coliform bacteria - Intestinal bacteria. • Escherichia coli (E. coli)
Question 8 • 8. Define: point source and non-point source (of water pollution). Give examples of each. • Point Sources - Discharge pollution from specific locations. • Factories, Power plants • Non-Point Sources - Scattered or diffuse, having no specific location of discharge. • Agricultural fields, Feedlots • Atmospheric Deposition
Oxygen-Demanding Wastes • Water with an oxygen content > 6 ppm will support desirable aquatic life. • Water with < 2 ppm oxygen will support mainly detritivores and decomposers. • Oxygen is added to water by diffusion from wind and waves, and by photosynthesis from green plants, algae, and cyanobacteria. • Oxygen is removed from water by respiration and oxygen-consuming processes.
Oxygen-Demanding Wastes • Biochemical Oxygen Demand - Amount of dissolved oxygen consumed by aquatic microorganisms. • Dissolved Oxygen Content - Measure of dissolved oxygen in the water. • Effects of oxygen-demanding wastes on rivers depend on volume, flow, and temperature of river water. • Oxygen Sag - Oxygen levels decline downstream from a pollution source as decomposers metabolize waste materials.
Plant Nutrients and Cultural Eutrophication • Oligotrophic - Bodies of water that have clear water and low biological productivity. • Eutrophic - Bodies of water that are rich in organisms and organic material. • Eutrophication - Process of increasing nutrient levels and biological productivity. • Cultural Eutrophication - Increase in biological productivity and ecosystem succession caused by human activities.
Toxic Tides • Excessive nutrients support blooms of deadly aquatic microorganisms in polluted waters. • Increasingly common where nutrients and wastes wash down rivers. • Pfiesteria piscicida is a poisonous dinoflagellate recognized as killer of fish and shellfish.
Inorganic Pollutants • Metals • Many metals such as mercury, lead, cadmium, and nickel are highly toxic. • Highly persistent and tend to bioaccumulate in food chains. • Lead pipes are a serious source of drinking water pollution. • Mine drainage and leaching are serious sources of environmental contamination.
Inorganic Pollutants • Nonmetallic Salts • Many salts that are non-toxic at low concentrations can be mobilized by irrigation and concentrated by evaporation, reaching levels toxic to plants and animals. • Leaching of road salts has had detrimental effect on many ecosystems. • Acids and Bases • Often released as by-products of industrial processes.
Organic Chemicals • Thousands of natural and synthetic organic chemicals are used to make pesticides, plastics, pharmaceuticals, pigments, etc. • Two most important sources of toxic organic chemicals in water are: • Improper disposal of industrial and household wastes. • Runoff of pesticides from high-use areas. • Fields, roadsides, golf courses
Sediment • Human activities have accelerated erosion rates in many areas. • Cropland erosion contributes about 25 billion metric tons of suspended solids to world surfaces each year. • Sediment can either be beneficial (nourish floodplains) or harmful (smother aquatic life).