Download
1 / 1
20 likes | 189 Vues
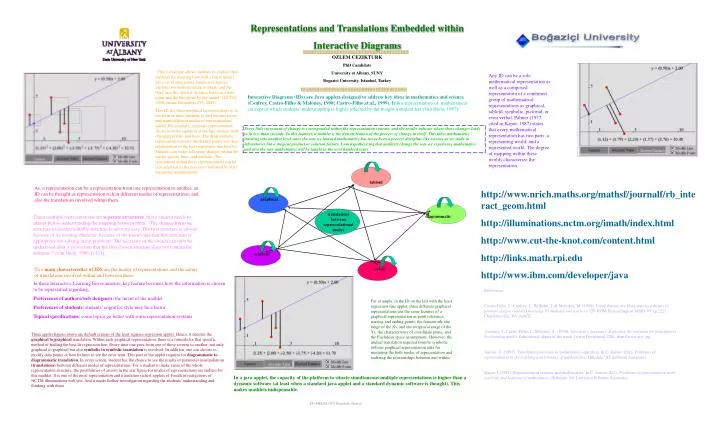
tabloid. graphical. translations between representational modes. symbolic. verbal. Representations and Translations Embedded within Interactive Diagrams OZLEM CEZIKTURK PhD Candidate University at Albany, SUNY Bogazici University, Istanbul, Turkey.

E N D
tabloid graphical translations between representational modes symbolic verbal Representations and Translations Embedded within Interactive Diagrams OZLEM CEZIKTURK PhD Candidate University at Albany, SUNY Bogazici University, Istanbul, Turkey “This e-example allows students to explore three methods for assuring how well a linear model fits a set of data points. Interactive figures explore two methods using residuals and the third uses the shortest distance between a data point and the line given by the model” (NCTM, 2000, online November 25th, 2002). This ID has three graphical representations as in the form of three methods to find the error term, and many different modes of representations added. For example, symbolic representation shows how the equation of the line changes with changing points, and lines. The diagrammatic representation shows the default points and their relationships to the least regression line best fit. Students can make following changes within the applet; points, lines, and methods. The translations within these representations can be characterized as the processes followed by after parameter manipulations. Any ID can be a sole mathematical representation as well as a composed representation of a combined group of mathematical representations as graphical, tabloid, symbolic, pictorial, or even verbal. Palmer (1977, cited in Kaput, 1987) states that every mathematical representation has two parts; a representing world, and a represented world. The degree of mapping within these worlds characterize the representation. Interactive Diagrams (IDs) are Java applets designed to address key ideas in mathematics and science (Confrey, Castro-Filho & Maloney, 1998; Castro-Filho,et.al., 1999).It isa representation of mathematical concept in which students’ understanding is highly affected by the insight a student has (Van Hiele, 1987). Every little increment of change is corresponded within the representation systems, and the results indicate where these changes leads to in less than seconds. In this manner, a mathlet is the demonstration of the process of change in itself. This takes mathematics learning into another level since the way we learned mathematics has never been a process discipline like science as we study in laboratories but a magical product or solution factory. I am hypothesizing that mathlets change the way we experience mathematics and also the way mathematics will be taught in the next hundred years. As, a representation can be a representation from one representation to another, an ID can be thought as representation rich in different modes of representations, and also the translations involved within them. http://www.nrich.maths.org/mathsf/journalf/rb_interact_geom.html http://illuminations.nctm.org/imath/index.html http://www.cut-the-knot.com/content.html http://links.math.rpi.edu http://www.ibm.com/developer/java These multiple representations are separate structures, that a student needs to master before understanding the mapping between them. “The change from one structure to another suitable structure is not very easy. The first structure is chosen because of its inviting character, because of the knowledge that this structure is appropriate for solving many problems. The necessity of the switch can only be understood after a conviction that the first chosen structure does not contain the solution. “ (van Hiele, 1986, p.131). diagrammatic Two main characteristics of IDS are the modes of representations and the nature of translations involved within and between these In these Interactive Learning Environments, key feature becomes how the information is chosen to be represented regarding; Preferences of authors/web designers; the intent of the mathlet Preferences of students; students’ cognitive style may be a factor Topical specifications; some topics go better with some representation systems References Castro-Filho, J., Confrey, J., Wilhelm, J.,& Meletiou, M. (1999). Using Interactive Diagrams as a means to promote deeper content knowledge by students and teachers. CD-ROM Proceedings of MSET 99’ (p.222). Charlottesville, VA: AACE. Confrey, J., Castro-Filho, J., Maloney, A. (1998). Interactive diagrams. Exploring the potential for java applets for learning math’s. Educational object of the week. [www Document] URL: http://www.eoe.org. Janvier, C. (1987). Translation processes in mathematics education. In C. Janvier (Ed.), Problems of representation in the teaching and learning of mathematics. Hillsdale, NJ: Erlbaum Associates. Kaput, J.(1987). Representation systems and mathematics. In C. Janvier (Ed.), Problems of representation in the teaching and learning of mathematics. Hillsdale, NJ: Lawrance Erlbaum Associates. For example, in the ID on the left with the least regression line applet, three different graphical representations use the same features of a graphical representation as point reference, starting and ending points, the framework, the range of the Xs, and the reciprocal range of the Ys, the characteristics of coordinate plane, and the Euclidean space assumptions. However, the mutual translation required from/to symbolic to/from graphical representation asks for mastering the both modes of representation and realizing the relationships between and within. Three applet figures above are default screens of the least squares regression applet. Hence, it denotes the graphical tographical translation. Within each graphical representation, there is a formula for that specific method of finding the best fit regression line. Every time one goes from one of these screens to another, not only graphical to graphical but also symbolic to symbolic translation is involved. In addition, one can choose to modify data points or best fit lines to see the error term. This part of the applet requires for diagrammatic to diagrammatic translation. In every screen, student has the chance to see the results of parameter manipulations (translations) between different modes of representations. For a student to make sense of the whole representation structure, the possibilities of arrows in the star figure for modes of representations are endless for this mathlet. It is one of the most representation and translation richest applets of I-math investigations of NCTM illuminations web site. And it needs further investigation regarding the students’ understanding and thinking with them. In a java applet, the capacity of the platform to situate simultaneous multiple representations is higher than a dynamic software (at least when a standard java applet and a standard dynamic software is thought). This makes mathlets indispensable. ED-MEDIA 2003 Honolulu, Hawaii