1 / 1

Figure 2 Unipolar voltage and LLS maps with the corresponding 2D quantitative polar maps

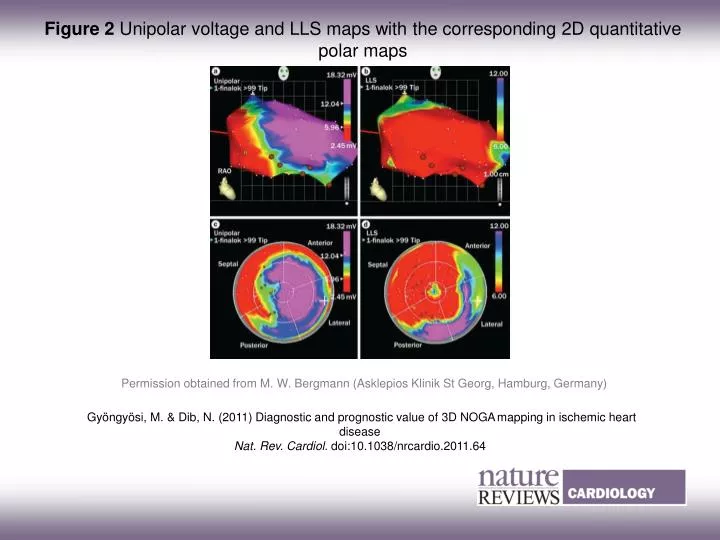
Figure 2 Unipolar voltage and LLS maps with the corresponding 2D quantitative polar maps. Permission obtained from M. W. Bergmann (Asklepios Klinik St Georg, Hamburg, Germany). Gyöngyösi, M. & Dib, N. (2011) Diagnostic and prognostic value of 3D NOGA mapping in ischemic heart disease

luyu
Télécharger la présentation

Figure 2 Unipolar voltage and LLS maps with the corresponding 2D quantitative polar maps

An Image/Link below is provided (as is) to download presentation Download Policy: Content on the Website is provided to you AS IS for your information and personal use and may not be sold / licensed / shared on other websites without getting consent from its author. Content is provided to you AS IS for your information and personal use only. Download presentation by click this link. While downloading, if for some reason you are not able to download a presentation, the publisher may have deleted the file from their server. During download, if you can't get a presentation, the file might be deleted by the publisher.

E N D

Presentation Transcript


  1. Figure 2 Unipolar voltage and LLS maps with the corresponding 2D quantitative polar maps Permission obtained from M. W. Bergmann (Asklepios Klinik St Georg, Hamburg, Germany) Gyöngyösi, M. & Dib, N. (2011) Diagnostic and prognostic value of 3D NOGAmapping in ischemic heart disease Nat. Rev. Cardiol. doi:10.1038/nrcardio.2011.64

More Related