Download
1 / 48
990 likes | 2.15k Vues
Strategic Cost Management. Prepared by Douglas Cloud Pepperdine University. Objectives. 1. Explain what strategic cost management is and how it can be used to help a firm create a competitive advantage.

E N D
Strategic Cost Management Prepared by Douglas Cloud Pepperdine University
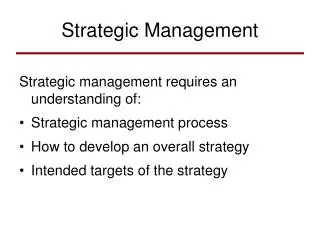
Objectives 1. Explain what strategic cost management is and how it can be used to help a firm create a competitive advantage. 2. Discuss a value-chain analysis and the strategic role of activity-based customer and supplier costing. 3. Tell what life-cycle cost management is and how it can be used to maximize profits over a product’s life cycle. After studying this chapter, you should be able to: Continued
Objectives 4.Identify the basic features of JIT purchasing and manufacturing. 5. Describe the effect JIT has on cost traceability and product costing.
Strategic Cost Management:Basic Concepts Strategic decision making is choosing among alternative strategies with the goal of selecting a strategy, or strategies, that provides a company with reasonable assurance of long-term growth and survival. The key to achieving this goal is to gain a competitive advantage. Strategic cost management is the use of cost data to develop and identify superior strategies that will produce a sustainable competitive advantage.
Strategic Cost Management:Basic Concepts Competitive advantage is the process of creating better customer value for the same or lower cost than that of competitors or creating equivalent value for lower cost than that of competitors. Customer value is the difference between what a customer receives (customer realization) and what the customer gives up (customer sacrifice). The total product is the complete range of tangible and intangible benefits that a customer receives from a purchased product.
General Strategies There are three general strategies that have been identified: • cost leadership • product differentiation • focusing
General Strategies Acost leadershipstrategyhappens when the same or better value is provided to customers at a lowercost than a company’s competitors. Example:A company might redesign a product so that fewer parts are needed, lowering production costs and the costs of maintaining the product after purchase.
General Strategies A differentiation strategy strives to increase customer value by increasing what the customer receives (customer realization). Example:A retailer of computers might offer on-site repair service, a feature not offered by other rivals in the local market.
General Strategies Afocusing strategyhappens when a firm selects or emphasizes a market or customer segment in which to compete. Example: Paging Network, Inc., a paging services provider, has targeted particular kinds of customers and is in the process of weeding out the nontargeted customers.
Industrial Value Chain The industrial value chain is the linked set of value-creating activities from basic raw materials to the disposal of the finished product by end-use customers. Fundamental to a value-chain framework is the recognition that there exist complex linkages and interrelationships among activities both within and external to the firm.
Internal and External Linkages There are two types of linkages that must be analyzed and understood: internal and external linkages. Internal linkages are relationships among activities that are performed within a firm’s portion of the value chain. External linkagesdescribe the relationship of a firm’s value-chain activities that are performed with its suppliersand customers. There are two types: supplier linkages and customer linkages.
Oil Exploration Oil Production Oil Distribution Oil Refining Gas Distribution Service Stations End-Use Customer Product Disposal Firm B Firm C Firm A Value Chain for the Petroleum Industry
Organizational Activities and Cost Drivers Organizational activities are of two types: structuralandexecutional. Structural activitiesare activities that determine the underlying economic structure of the organization. Executional activities are activities that define the processes and capabilities of an organization and thus are directly related to the ability of an organization to execute successfully.
Organizational Activities and Cost Drivers Structural Activities Structural Cost Drivers Building plants Number of plants, scale, degree of centralization Management structuring Management style and philosophy Grouping employees Number and type of work units Complexity Number of product lines, number of unique processes, number of unique parts Vertically integrating Scope, buying power, selling power Selecting and using process Types of process technologies, technologies experience
Organizational Activities and Cost Drivers Educational Activities Educational Cost Drivers Using employees Degree of involvement Providing quality Quality management approach Providing plant layout Plant layout efficiency Designing and producing products Product configuration Providing capacity Capacity utilization
Operational Activities Operational activitiesare day-to-day activities performed as a result of the structure and processes selected by the organization. Examples:Receiving and inspecting incoming parts, moving materials, shipping products, testing new products, servicing products, and setting up equipment.
Organizational and Operational Activity Relationships Organizational Activity (Selecting and using process technologies) Operational Driver (Number of moves) Structural Cost Driver (JIT: Type of process technology) Operational Activity (Moving material)
Internal Value Chain Design Service Develop Distribute Product Market
Internal Linkages: An Example Design engineers have been told that the number of parts is a significant cost driver and that reducing the number of parts will reduce the demand for various activities downstream in the value chain. They plan to reduce the price by per-unit savings. Currently 10,000 units are produced. The data of the new design and its effects on demand are given in slide 13-20.
Activities Activity Driver Capacity Demand Demand Material usage Number of parts 200,000 200,000 80,000 Assembling parts Direct labor hours 10,000 10,000 5,000 Purchasing parts Number of orders 15,000 12,500 6,500 Warranty repair Number of defective products 1,000 800 500 Internal Linkages: An Example
Internal Linkages: An Example Additionally, the following activity cost data are provided: Material usage: $3 per part used; no fixed activity cost. Assembly: $12 per direct labor hour; no fixed activity cost Purchasing: Three salaried clerks, each earning a $30,000 annual salary; each clerk is capable of processing 5,000 purchase orders annually. Variable activity costs: $0.50 per purchase order processed for forms, postage, etc. Warranty: Two repair agents, each paid a salary of $28,000 per year; each repair agent is capable of repairing 500 units per year. Variable activity costs: $20 per product repaired.
Internal Linkages: An Example Cost Reduction from Exploiting Internal Linkages Material usage: (200,000 – 80,000)$3 $360,000 Labor usage: (10,000 – 5,000)$12 60,000 Purchasing: [$30,000 + $.50(12,500 – 6,500)] 33,000 Warranty repair: [($28,000 + $20(800 – 500)] 34,000 Total $487,000 Units 10,000 Unit savings $48.70
Step Cost Behavior: Purchasing Activity Cost $90,000 60,000 30,000 5 6.5 10 12.5 15 20 Number of Purchase Orders (in thousands)
Activity-Based Supplier Costing Reworking rate = $200,000/1,000 800 + 190 + 5 + 5 Reworking rate = $200 per failed component Expediting rate = $50,000/50 30 + 20 Expediting rate = $1,000 per late delivery
Activity-Based Customer Costing Large Ten Customer Smaller Customers Units purchased 500,000 500,000 Orders placed 2 200 Manufacturing cost $3,000,000 $3,000,000 Order-filling cost allocated* $303,000 $303,000 Order cost per unit $0.606 $0.606 *Order-filling capacity is purchased in blocks of 45 (225 capacity), each block costing $40,400; variable order-filling activity costs are $2,000 per order; thus, the cost is [(5 x $40,400) + ($2,000 x 202)]
Product Life Cycle Viewpoints There are three basic views of the product life cycle: • Marketing viewpoint • Production viewpoint • Consumable life viewpoint
Marketing Viewpoint Units of sales Introduction Growth Maturity Decline
Production Viewpoint Cost Commitment Curve Life Cycle Cost % 100 75 50 25 Research Planning Design Testing Production Logistics
A Life Cycle Costing Example Suppose that engineers are considering two new product designs for one of its power tools. Both designs reduce direct materials and direct labor content over the current model. The anticipated effects of the two designs on manufacturing, logistical, and postpurchase activities costs are listed on slide 13-30.
A Life Cycle Costing Example Cost Behavior Functional-based system: Variable conversion activity rate: $40 per direct labor hour Material usage rate: $8 per part ABC system: Labor usage $10 per direct labor hour Material usage: $8 per part Machining: $28 per machine hour Purchasing activity: $60 per purchase order Setup activity: $1,000 per setup hour Warranty activity: $200 per returned unit Customer repair cost: $10 per hour
A Life Cycle Costing Example Traditional costing (overhead allocated by direct labor hours) Design A Design B Direct materials $ 800,000 $ 480,000 Conversion costb 2,000,000 3,200,000 Total manufacturing cost $2,800,000 $ 3,680,000 Units produced 10,000 10,000 Unit cost $ 280 $ 368 a$8 x 100,000 parts; $8 x 60,000 parts b$40 x 50,000 direct labor hours; $40 x 80,000 direct labor hours
A Life Cycle Costing Example ABC Costing (Overhead allocated by direct labor hours) Design ADesign BClassification Direct materials $ 800,000 $ 480,000 Manufacturing Direct labora 500,000 800,000 Manufacturing Machiningb 700,000 560,000 Manufacturing Purchasingc 18,000 12,000 Upstream Setupsd 200,000 100,000 Manufacturing Warrantye 80,000 15,000 Downstream Total product costs $2,298,000 $1,967,000 Units productd 10,000 10,000 Unit cost $ 230$ 197 Postpurchase costs $ 80,000 $ 15,000
Role of Target Costing A company is considering the production of a new trencher. Current product specifications and the targeted market share call for a sales price of $250,000. The required profit is $50,000 per unit. The target cost is computed as follows: Target cost = $250,000 – $50,000 = $200,000
Target-Costing Model Target Profit Target Cost Product and Process Design Target cost met? NO YES Produce Product Market Share Objective Target Price Product Functionality
Product A A A Abrasive Grinders Welding Equipment Lathes Product B B B Department. 1 Department 2 Department 3 Traditional Manufacturing Layout Each process passes through departments that specialize in one process. Finished Product A Finished Product B
Grinder Grinder Welding Welding Lathe Lathe Product A Product B Finished Product A Finished Product B JIT Manufacturing Layout Cell A Cell B
Traditional Inventory Systems • Push-through system • Significant inventories • Large supplier base • Short-term supplier contracts • Departmental structure • Specialized labor • Centralized services • Low employee involvement • Supervisory management style • Acceptable quality level • Driver tracing dominates
JIT Inventory Systems • Pull-through system • Insignificant inventories • Small supplier base • Long-term supplier contracts • Cellular structure • Multiskilled labor • Decentralized services • High employee involvement • Facilitating management style • Total quality control • Direct tracing dominates
Traditional Journal Entry Materials Inventory 160,000 Accounts Payable 160,000 Back-Flush Journal Entry Raw Materials and In-Process Inv. 160,000 Accounts Payable 160,000 Backfushing Compared with Traditional Cost Flow Accounting Transaction: Raw materials were purchased on account for $160,000.
Traditional Journal Entry Work-in-Process Inventory 160,000 Materials Inventory 160,000 Back-Flush Journal Entry No entry Backfushing Compared with Traditional Cost Flow Accounting Transaction: All materials received were issued into production.
Traditional Journal Entry Work-in-Process Inventory 25,000 Wages Payable 25,000 Back-Flush Journal Entry Combined with overhead; See next entry. Backfushing Compared with Traditional Cost Flow Accounting Transaction: Actual direct labor cost, $25,000.
Traditional Journal Entry Overhead Control 225,000 Accounts Payable 225,000 Back-Flush Journal Entry Conversion Cost Control 250,000 Wages Payable 25,000 Accounts Payable 225,000 Backfushing Compared with Traditional Cost Flow Accounting Transaction: Actual overhead costs, $225,000.
Traditional Journal Entry Work-in-Process Inventory 235,000 Overhead Control 235,000 Back-Flush Journal Entry No entry. Backfushing Compared with Traditional Cost Flow Accounting Transaction: Conversion costs applied, $235,000.
Traditional Journal Entry Finished Goods Inventory 395,000 Work-in-Process Inventory 395,000 Back-Flush Journal Entry Finished Goods Inventory 395,000 Raw Materials and in-Process Inv. 160,000 Conversion Cost Control 235,000 Backfushing Compared with Traditional Cost Flow Accounting Transaction: All work was completed for the month.
Traditional Journal Entry Cost of Goods Sold 395,000 Finished Goods Inventory 395,000 Back-Flush Journal Entry Cost of Goods Sold 395,000 Finished Goods Inventory 395,000 Backfushing Compared with Traditional Cost Flow Accounting Transaction: All completed work was sold.
Traditional Journal Entry Cost of Goods Sold 15,000 Overhead Control 15,000 Back-Flush Journal Entry Cost of Goods Sold 15,000 Conversion Cost Control 15,000 Backfushing Compared with Traditional Cost Flow Accounting Transaction: Variance is recognized.
End of Chapter