Download
1 / 9
90 likes | 173 Vues
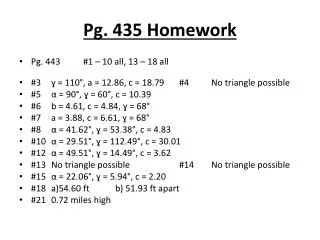
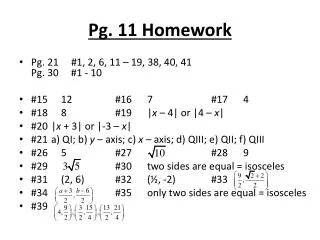
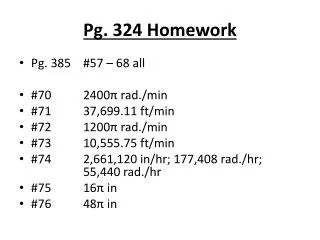
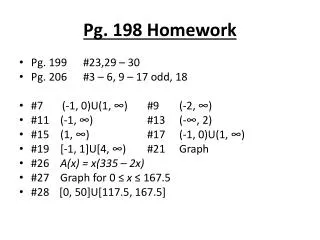
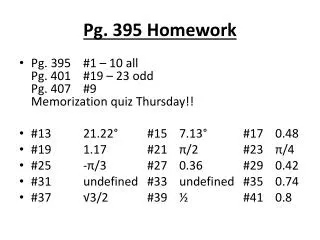
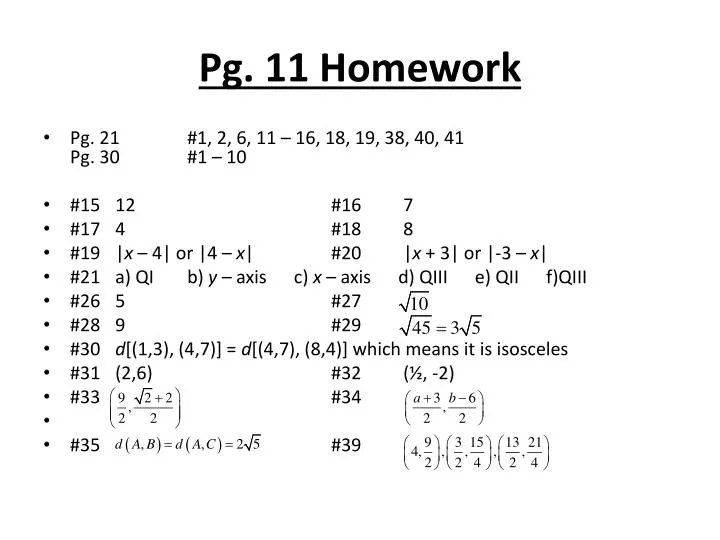
Pg. 11 Homework. Pg. 21 #1, 2, 6, 11 – 16, 18, 19, 38, 40, 41 Pg. 30 #1 – 10 #15 12 #16 7 #17 4 #18 8 #19 | x – 4| or |4 – x | #20 | x + 3| or |-3 – x | #21 a) QI b) y – axis c) x – axis d) QIII e) QII f)QIII #26 5 #27 #28 9 #29

E N D
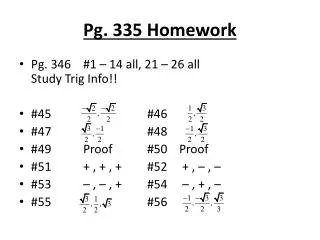
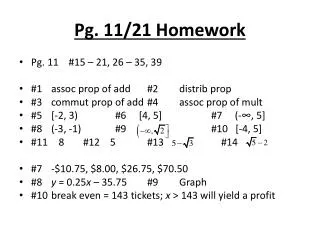
Pg. 11 Homework • Pg. 21 #1, 2, 6, 11 – 16, 18, 19, 38, 40, 41Pg. 30 #1 – 10 • #15 12 #16 7 • #17 4 #18 8 • #19 |x – 4| or |4 – x| #20 |x+ 3| or |-3 – x| • #21 a) QI b) y – axis c) x – axis d) QIII e) QII f)QIII • #26 5 #27 • #28 9 #29 • #30 d[(1,3), (4,7)] = d[(4,7), (8,4)] which means it is isosceles • #31 (2,6) #32 (½, -2) • #33 #34 • #35 #39
1.1 Real Numbers and the Coordinate Plane Absolute Value Examples Write the expression without using absolute value notation • Definition • Formal • If a is a real number, then the absolute value of a if given by: • Informal • The distance from zero on the number line.
1.1 Real Numbers and the Coordinate Plane Domain and Range Graphing Windows When in doubt, what do you ZOOM to? What are you other options? • Domain • The domain is all the possible input values of a function. • All the possible x – values. • Range • The range is all the possible output values of a function. • All the possible y – values.
1.2 Graphing Utilities and Complete Graphs Problem Solving Example It costs $8 to enter the fair. Each ticket towards a ride costs $0.75. Generalize the pattern from the given information. • Read the problem • Re-read the problem • State the problem in your own words • Define the variables in the problem • Clearly identify what you are given and what you are looking for
1.2 Graphing Utilities and Complete Graphs Looking at Your Information You only have $20. You want to ride the Tilt-a Whirl twice and roller coaster once. If the Tilt-a Whirl requires 5 tickets. Will you have any money left over for cotton candy? • The roller coaster requires 6 tickets to ride. How much money total will you spend to ride the roller coaster twice?
1.2 Graphing Utilities and Complete Graphs Proper Windows Sketches of Complete Graphs Must contain all data from a given table Must suggest a pattern from the table The equation must model the data for every point in the table This gives one possible complete graph through the points in the given table • Finding a proper window:
1.2 Graphing Utilities and Complete Graphs x y -3 -15 -2.5 -5.625 -2 0 -1.5 2.625 -1 3 -0.5 1.875 0 0 0.5 -1.875 1 -3 1.5 -2.625 2 0 2.5 5.625 3 15
1.3 Functions Functions All functions must pass the VLT!! Functions can be graphed Functions are equations in two variables All functions have a domain and range • A function of x is a correspondence that associates each x in a set X with exactly one y in a set Y. • If x is the input value and y is the output value we call y the image of x under f. • For all functions:
1.3 Functions Function Values Are the following functions? • Find the function values