Download
1 / 1
10 likes | 127 Vues
Configuration Mapping: Electron Beam Wire Tomography

E N D
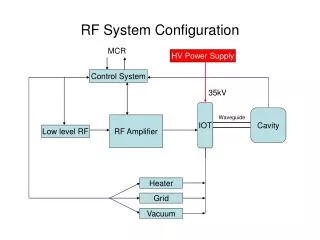
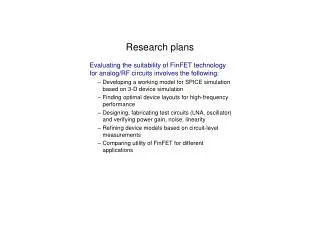
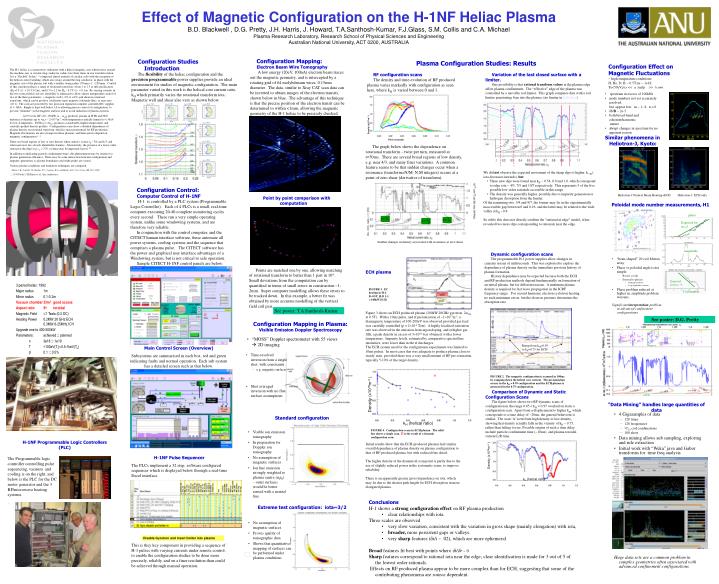
Configuration Mapping: Electron Beam Wire Tomography A low energy (20eV, 100nA) electron beam traces out the magnetic geometry, and is intercepted by a rotating grid of 64 molybdenum wires, 0.15mm diameter. The data, similar to Xray CAT scan data can be inverted to obtain images of the electron transits, shown below in blue. The advantage of this technique is that the precise position of the electron transit can be determined to within <1mm, allowing the magnetic geometry of the H-1 heliac to be precisely checked. Disable Gyrotron and insert limiter into plasma Expected for m = -4 Point by point comparison with computation Ramp from kH=0.95 to kH=0.75 for ECH Points are matched one by one, allowing matching of rotational transform to better than 1 part in 104. Small deviations from the computation can by quantified in terms of small errors in construction ~1-2mm. Super computer modelling allows these errors to be tracked down. In this example, a better fir was obtained by more accurate modelling of the vertical field coil pair. Configuration Mapping in Plasma:Visible Emission Doppler Spectroscopy See poster: T.A Santhosh-Kumar • “MOSS” Doppler spectrometer with 55 views 2D imaging • Time-resolved inversion from a single shot, with constraints • e.g. magnetic surfaces • Shot averaged inversion with no flux surface assumptions Standard configuration • Visible ion emission tomography • In preparation for Doppler ion tomography • No assumption of magnetic surfaces • Ion line emission strongly weighted to plasma centre (nine) – outer surfaces would be better sensed with a neutral line. Extreme test configuration: iota~3/2 • No assumption of magnetic surfaces • Proves quality of tomographic data • Shows that quantitative mapping of surfaces can be performed under plasma conditions Effect of Magnetic Configuration on the H-1NF Heliac Plasma B.D. Blackwell , D.G. Pretty, J.H. Harris, J. Howard, T.A.Santhosh-Kumar, F.J.Glass, S.M. Collis and C.A. Michael Plasma Research Laboratory, Research School of Physical Sciences and Engineering Australian National University, ACT 0200, AUSTRALIA Configuration Studies Introduction The flexibility of the heliac configuration and the precision programmable power supplies provide an ideal environment for studies of magnetic configuration. The main parameter varied in this work is the helical core current ratio, kH which primarily varies the rotational transform iota. Magnetic well and shear also vary as shown below. Plasma Configuration Studies: Results Configuration Effect on Magnetic Fluctuations ~ high temperature conditions: H, He, D; B ~ 0.5T;ne ~ 1e18; Te<50eVi,e << a, mfp >> conn The H-1 heliac is a current-free stellarator with a helical magnetic axis which twists around the machine axis (a circular ring conductor, radius 1m) three times in one toroidal rotation. It is a “flexible” heliac [[i]] composed almost entirely of circular coils with the exception of the helical control winding, which also wraps around the ring conductor, in phase with the magnetic axis of the plasma, but with a smaller swing radius (95mm c.f. ~230mm). Control of this current produces a range of rotational transform from 1 to 1.5 at full specification (B0 =1T, r > 0.15-0.2m), and 0.7 to 2.2 for B0 ~ 0.5T, r> 0.1m. By varying currents in the two vertical field coil sets, flexibility is enhanced to allow almost independent control of two of the three parameters: , magnetic well (–2% to +6%) and shear in rotational transform., which can be positive (stellarator-type) negative (tokamak-like), or near zero (<0.1). The coils are powered by two precision regulated computer controlled DC supplies of 1-14kA. Ripple is kept well below 1A to allowing precise control of configuration, to prevent “shimmer” in the magnetic surfaces and to avoid induction of plasma currents. At 0.5 tesla, RF (20 ~150kW, ~ cH) produces plasma in H:He and H:D mixtures at densities up to <ne> ~ 21018m-3, with temperatures initially limited to < 50eV by low-Z impurities. ECH ( = 2ce) produces considerably higher temperatures and centrally-peaked density profiles. Configuration scans show a detailed dependence of plasma density on rotational transform, which is more pronounced for RF production. Magnetic fluctuations are also stronger in these plasmas, and their spectra depend on magnetic configuration [[ii]]. There are broad regions of low or zero density when central is near 0 ~ 5/4 and 4/3, and other narrower, less clearly identifiable features. Alternatively, the presence of a lower order rational at the edge (e.g. a = 7/5), or shear may be important factors [2]. In addition to indicating particle confinement times, this phenomenon may be sensitive to plasma generation efficiency. There may be some interaction between configuration and impurity generation, as plasma boundaries and strike points are varied. Various plasma conditions and formation techniques are compared. [i]Harris, J.H., Cantrell, J.L. Hender, T.C., Carreras, B.A. and Morris, R.N. Nucl. Fusion25, 623 (1985). [ii] D.G Pretty, J.H.Harris et al., this conference. RF configuration scans The density and time-evolution of RF produced plasma varies markedly with configuration as seen here, where kH is varied between 0 and 1. Variation of the last closed surface with a limiter. One possibility is that rational transform values at the plasma edge affect plasma confinement. The “effective” edge of the plasma was controlled by a movable rod limiter. This graph compares data with a rod limiter penetrating 4cm into the plasma. (no limiter in light blue) • spectrum in excess of 100kHz • mode numbers not yet accurately resolved, but appear low: m ~ 1- 8, n > 0 • b/B ~ 2e-5 • both broad-band and coherent/harmonic nature • abrupt changes in spectrum for no apparent reason • Similar phenomena inHeliotron-J, Kyoto: Density (x1018m-3 ) Time (seconds) The graph below shows the dependence on rotational transform – twist per turn, measured at t=50ms. There are several broad regions of low density, e.g. near 4/3, and many finer variations. A common feature seems to be that sudden changes occur when a resonance (transform=N/M: N,M integers) occurs at a point of zero shear (derivative of transform). • We did not observe the expected movement of the sharp dips to higher k_H ( iota decreases inwards), but • Three new dips were found near kH ~ 0.54, 0.9 and 1.0, which correspond to edge iota ~ 4/3, 7/5 and 10/7 respectively. This represents 3 of the five possible low order rationals accessible in this range. • The density was generally higher, possibly due to impurity generation or hydrogen desorption from the limiter. • Of the remaining two, 5/4 and 9/7, the former may lie in the experimentally inaccessible gap between 0 and 0.16, and the latter may be related to the wide valley at kH ~0.4. • So while this does not directly confirm the “rational at edge” model, it has revealed two more dips corresponding to rationals near the edge. Configuration Control: Computer Control of H-1NF H-1 is controlled by a PLC system (Programmable Logic Controller). Each of 4 PLCs is a small, real-time computer executing 20-40 complete monitoring cycles every second. These run a very simple operating system, unlike some windowing systems, and are therefore very reliable. In conjunction with the control computer, and the CITECT human interface software, these automate all power systems, cooling systems and the sequence that comprises a plasma pulse. The CITECT software has the power and graphical user interface advantages of a Windowing system, but is not critical to safe operation. Sample CITECT H-1NF control panels are below: Heliotron-J Neutral Beam Heating+ECH Heliotron-J ECH only Poloidal mode number measurements, H1 phase Expected for m =2 Sudden changes in density associated with resonance at zero shear magnitude Dynamic configuration scans The programmable H-1 power supplies allow changes in currents in tens of milliseconds. This was exploited to explore the dependence of plasma density on the immediate previous history of plasma formation. History dependence may be expected because both the ECH and RF production methods depend fundamentally on formation of an initial plasma, but for different reasons. A minimum plasma density is required for fast wave propagation in the ICRF frequency range. For second harmonic electron cyclotron heating, no such minimum exists, but the electron pressure determines the absorption rate. • “bean-shaped” 20 coil Mirnov array • Phase vs poloidal angle is not simple • Boozer coords • External to plasma • Propagation effects • Large amplitude variation • Phase problem reduced at higher m, amplitude problem worsens. Significant interpretation problem in advanced confinement configurations ECH plasma Figure 3 shows an ECH produced plasma (200kW 28GHz gyrotron, 2CE at 0.5T). With a 10ms pulse, and rf preionization of ~11017m-3, a diamagnetic temperature of 100-200eV was observed provided gas feed was carefully controlled (p < 210-6 Torr). A highly localised ionization rate was observed in the emission from argon doping, and at higher gas fills, a peak density in excess of 31018 was obtained, with a lower temperature. Impurity levels, estimated by comparative spectral line intensities, were lower than in the rf discharges. The ECH system used for the configuration experiments was limited to 10ms pulses. In most cases this was adequate to produce plasma close to steady state, provided there was a very small amount of RF pre-ionization, typically 5-10% of the target density.. Coil number 3 period heliac: 1992 Major radius 1m Minor radius 0.1-0.2m Vacuum chamber 33m2 good access Aspect ratio 5+ toroidal Magnetic Field 1 Tesla (0.2 DC) Heating Power 0.2MW 28 GHz ECH 0.3MW 6-25MHz ICH Upgrade one to 400-500kW Parameters: achieved :: planned n3e18 :: 1e19 T<100eV(Ti)::0.5-1keV(Te) 0.1 :: 0.5% FIGURE 3. EC heating in H-1, B~0.5T, H:D 1:1, > 100kW ECH. Coil number See poster: D.G. Pretty 2-4 • mode numbers related to rationals 2-4 Mostly 0-3 3-8 4-5, 7-8 Main Control Screen (Overview) Subsystems are summarised in each box, red and green indicating faults and normal operation. Each sub system has a detailed screen such as that below. FIGURE 2. The magnetic configuration is scanned in 100ms by ramping down the helical core current. The preionization occurs in the kH = 0.95 configuration and the ECH plasma is generated in the 0.75 configuration. Comparison of Dynamic and Static Configuration Scans The figure below shows two RF dynamic scans of configuration in the range 0.65 < kH < 0.95 overlaid on static a configuration scan. Apart from a displacement to higher kH, which corresponds to a time delay of ~20ms, the general behaviour is similar. The scan ‘A’ went from high density to low density, showing that density actually falls in the vicinity of kH ~ 0.75, rather than failing to rise. Possible origins of such a time delay include particle confinement time (~10ms), and plasma toroidal current L/R time. Density (x1018m-3 ) “Data Mining” handles large quantities of data • 4 Gigasamples of data • 128 times • 128 frequencies • 2C20 coil combinations • 100 shots • Data mining allows sub sampling, exploring and rule extraction • Initial work with “Weka” java and Gabor transforms for time freq analysis Huge data sets are a common problem in complex geometries often associated with advanced confinement configurations kH (helical ratio) FIGURE 4. Configuration scans in ECH plasma. The solid line shows a single scan, is the result of a dynamic configuration scan. H-1NF Programmable Logic Controllers(PLC) Initial results show that the ECH-produced plasmas had similar overall dependence of plasma density on plasma configuration to that of RF-produced plasma, but with reduced fine detail. The higher density of the dynamical scan point is partly due to the use of slightly reduced power in the systematic scans, to improve reliability. There is an apparently greater gross dependence on iota, which may be due to the shorter path length for ECH absorption in more elongated plasma. Density (x1018m-3 ) H-1NF Pulse Sequencer The PLCs implement a 32 step, software configured sequencer which is displayed below through a real-time Excel interface. This is they key component in providing a sequence of H-1 pulses with varying currents under remote control, to enable the configuration studies to be done more precisely, reliably, and on a finer resolution than could be achieved through manual operation. The Programmable logic controller controlling pulse sequencing, vacuum and cooling is on the right, and below is the PLC for the DC motor generator and the 3 RF/microwave heating systems. . kH (helical ratio) • Conclusions • H-1 shows a strong configuration effect on RF plasma production • clear relationships with iota. • Three scales are observed • very slow variation, consistent with the variation in gross shape (mainly elongation) with iota, • broader, more persistent gaps or valleys. • very sharp features (i/i ~ .02), which are more ephemeral • Broad features fit best with points where i/r ~ 0 • Sharp features correspond to rational iota near the edge; clear identification is made for 3 out of 5 of the lowest order rationals. • Effects on RF produced plasma appear to be more complex than for ECH, suggesting that some of the contributing phenomena are source dependent.