Download
1 / 1
10 likes | 159 Vues
The Effects of the Arctic, North Atlantic and El Niño-Southern Oscillation on Climate in the New York Metropolitan Area. Abstract. Results.

E N D
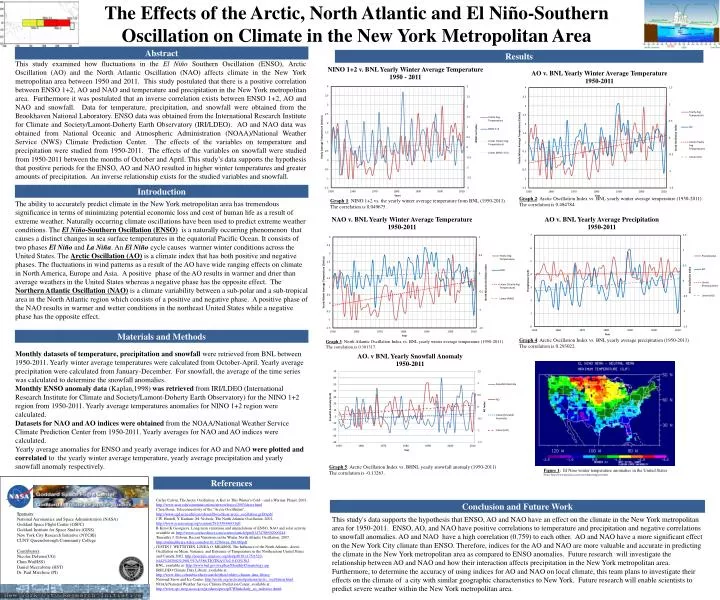
The Effects of the Arctic, North Atlantic and El Niño-Southern Oscillation on Climate in the New York Metropolitan Area Abstract Results This study examined how fluctuations in the El Niño Southern Oscillation (ENSO), Arctic Oscillation (AO) and the North Atlantic Oscillation (NAO) affects climate in the New York metropolitan area between 1950 and 2011. This study postulated that there is a positive correlation between ENSO 1+2, AO and NAO and temperature and precipitation in the New York metropolitan area. Furthermore it was postulated that an inverse correlation exists between ENSO 1+2, AO and NAO and snowfall. Data for temperature, precipitation, and snowfall were obtained from the Brookhaven National Laboratory. ENSO data was obtained from the International Research Institute for Climate and Society/Lamont-Doherty Earth Observatory (IRI/LDEO). AO and NAO data was obtained from National Oceanic and Atmospheric Administration (NOAA)/National Weather Service (NWS) Climate Prediction Center. The effects of the variables on temperature and precipitation were studied from 1950-2011. The effects of the variables on snowfall were studied from 1950-2011 between the months of October and April. This study’s data supports the hypothesis that positive periods for the ENSO, AO and NAO resulted in higher winter temperatures and greater amounts of precipitation. An inverse relationship exists for the studied variables and snowfall. Introduction Graph 2: Arctic Oscillation Index vs. BNL yearly winter average temperature (1950-2011). The correlation is 0.484784. Graph 1: NINO 1+2 vs. the yearly winter average temperature from BNL (1950-2011). The correlation is 0.049675. • The ability to accurately predict climate in the New York metropolitan area has tremendous significance in terms of minimizing potential economic loss and cost of human life as a result of extreme weather. Naturally occurring climate oscillations have been used to predict extreme weather conditions. The El Niño-Southern Oscillation (ENSO)is a naturally occurring phenomenon that causes a distinct changes in sea surface temperatures in the equatorial Pacific Ocean. It consists of two phases El Niño and La Niña. An El Niño cycle causes warmer winter conditions across the United States. The Arctic Oscillation (AO) is a climate index that has both positive and negative phases. The fluctuations in wind patterns as a result of the AO have wide ranging effects on climate in North America, Europe and Asia. A positive phase of the AO results in warmer and drier than average weathers in the United States whereas a negative phase has the opposite effect. The Northern Atlantic Oscillation(NAO)is a climate variability between a sub-polar and a sub-tropical area in the North Atlantic region which consists of a positive and negative phase. A positive phase of the NAO results in warmer and wetter conditions in the northeast United States while a negative phase has the opposite effect. Materials and Methods Graph 4: Arctic Oscillation Index vs. BNL yearly average precipitation (1950-2011) The correlation is 0.293022. Graph 3: North Atlantic Oscillation Index vs. BNL yearly winter average temperature (1950-2011) The correlation is 0.301317. Monthly datasets of temperature, precipitation and snowfall were retrieved from BNL between 1950-2011. Yearly winter average temperatures were calculated from October-April. Yearly average precipitation were calculated from January-December. For snowfall, the average of the time series was calculated to determine the snowfall anomalies. Monthly ENSO anomaly data (Kaplan,1998) was retrieved from IRI/LDEO (International Research Institute for Climate and Society/Lamont-Doherty Earth Observatory) for the NINO 1+2 region from 1950-2011. Yearly average temperatures anomalies for NINO 1+2 region were calculated. Datasets for NAO and AO indices were obtained from the NOAA/National Weather Service Climate Prediction Center from 1950-2011. Yearly averages for NAO and AO indices were calculated. Yearly average anomalies for ENSO and yearly average indices for AO and NAO were plotted and correlated to the yearly winter average temperature, yearly average precipitation and yearly snowfall anomaly respectively. Graph 5: Arctic Oscillation Index vs. BHNL yearly snowfall anomaly (1950-2011) The correlation is -0.13263. Figure 1: El Nino winter temperature anomalies in the United States From: http://www.pmel.noaa.gov/tao/elnino/impacts.html References Carlye Calvin, The Arctic Oscillation: A Key to This Winter's Cold—and a Warmer Planet, 2003, http://www.ucar.edu/communications/newsreleases/2003/deser.html Clara Deser, Teleconnectivity of the “Arctic Oscillation”, http://www.cgd.ucar.edu/cas/cdeser/Docs/deser.arctic_oscillation.grl00.pdf J.W. Hurrell, Y. Kushnir, M. Visbeck, The North Atlantic Oscillation, 2001, http://www.sciencemag.org/content/291/5504/603.full B Kirov,K Georgieva, Long-term variations and interrelations of ENSO, NAO and solar activity, available at: http://www.sciencedirect.com/science/article/pii/S1474706502000244 Timonthy J. Osborn, Recent Variations in the Winter North Atlantic Oscillation, 2007, http://onlinelibrary.wiley.com/doi/10.1256/wea.190.06/pdf JUSTIN J. WETTSTEIN, LINDA O. MEARNS, The Influence of the North Atlantic–Arctic Oscillation on Mean, Variance, and Extremes of Temperature in the Northeastern United States and Canada,2002, http://journals.ametsoc.org/doi/pdf/10.1175/1520-0442%282002%29015%3c3586:TIOTNA%3e2.0.CO%3b2 BNL, available at: http://www.bnl.gov/weather/MonthlyClimatology.asp IRI/LDEO Climate Data Library, available at: http://www.ldeo.columbia.edu/research/other/irildeo-climate-data-library National Snow and Ice Center, http://nsidc.org/arcticmet/patterns/arctic_oscillation.html NOAA/National Weather Service Climate Prediction Center, available at: http://www.cpc.ncep.noaa.gov/products/precip/CWlink/daily_ao_index/ao.shtml Conclusion and Future Work Sponsors: National Aeronautics and Space Administration (NASA) Goddard Space Flight Center (GSFC) Goddard Institute for Space Studies (GISS) New York City Research Initiative (NYCRI) CUNY Queensborough Community College Contributors: Nicolas DeJesus(UG) Chun Wu(HSS) Daniel Mezzafonte (HST) Dr. Paul Marchese (PI) This study's data supports the hypothesis that ENSO, AO and NAO have an effect on the climate in the New York metropolitan area for 1950-2011. ENSO, AO, and NAO have positive correlations to temperature and precipitation and negative correlations to snowfall anomalies. AO and NAO have a high correlation (0.759) to each other. AO and NAO have a more significant effect on the New York City climate than ENSO. Therefore, indices for the AO and NAO are more valuable and accurate in predicting the climate in the New York metropolitan area as compared to ENSO anomalies. Future research will investigate the relationship between AO and NAO and how their interaction affects precipitation in the New York metropolitan area. Furthermore, to determine the accuracy of using indices for AO and NAO on local climate, this team plans to investigate their effects on the climate of a city with similar geographic characteristics to New York. Future research will enable scientists to predict severe weather within the New York metropolitan area. /