Download
1 / 41
410 likes | 512 Vues
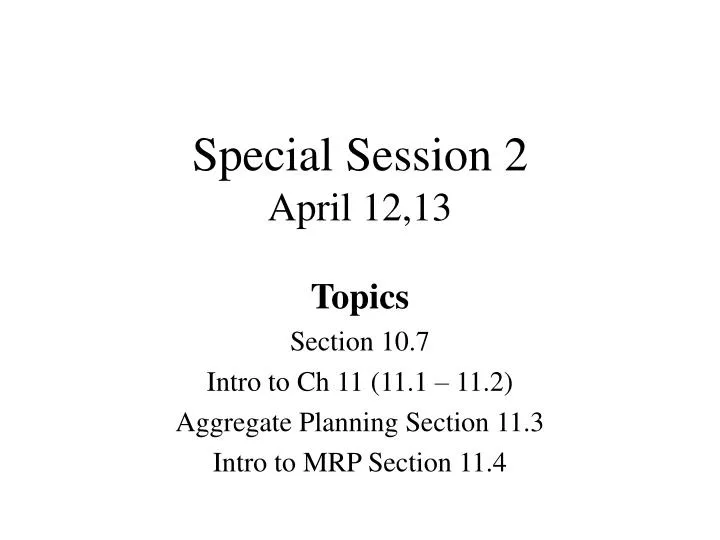
Special Session 2 April 12,13. Topics Section 10.7 Intro to Ch 11 (11.1 – 11.2) Aggregate Planning Section 11.3 Intro to MRP Section 11.4. Section 10.7. In previous models, we assume no variability

E N D
Special Session 2April 12,13 Topics Section 10.7 Intro to Ch 11 (11.1 – 11.2) Aggregate Planning Section 11.3 Intro to MRP Section 11.4
Section 10.7 • In previous models, we assume no variability • In this section we change this by including demand variability during lead time (lead time = time it takes for our supplier to deliver the order) • There are two characteristics of this type of problem • Service Level (the percentage of time we will have inventory during the lead time • A service level of 98% means we will be out of inventory on 2% of the time during lead time demand. • Variability of demand during lead time (standard deviation) L
Section 10.7 • To account for demand variability, we will maintain a safety stock of inventory. This safety stock will protect us from the high side of demand variability. • The average inventory increases by the safety stock so its an additional cost. • The amount we order does not change • The reorder point changes • R = d L + Safety Stock • For example, we always order 20 boxes of cereal (the Q), • Lead time is 4 days and daily demand is 2 boxes, so we reorder at 8 (the R), so the order arrives as we get to zero. • If plan a safety stock of 4 boxes, what happens? The reorder point is 12 boxes (8 from before + the safety stock of 4) so when we get to 12 boxes we send the signal to our supplier, and the new shipment of 20 arrives when we have about 4 left (this is the safety stock)
L d2 L = Section 10.7 • Calculations • R = d L + ss (L = Lead time, d = demand per lead time unit, ss = Safety Stock) • ss = Z L • Z = Z value from the desired service level • Look out in Appendix 1 the following service levels: • 98% : Z = 2.1 (look at the top right column in the appendix, the first value that gets to 0.98, 0.98214 with a Z of 2.1) • 99% : Z = 2.35 • 99.99%: Z = 3.75 • L = Standard deviation of demand during Lead time • d = Standard deviation of demand per time unit
Section 10.7 Example 1. L = 4 weeks, and d = 5 units/week, and d = 50 units/week (so in most weeks demand ranges from 45 to 55 units per week) What is R at Service Levels of 98%, 99%, and 99.99%? R = d L + ss = 200 + ss ss = Z L L = sqrt (4 x 25) = 10 at SL = 98%, Z = 2.1, R = 200 + 21 = 221 at SL = 99%, Z = 2.35, R = 200 + 23.5 = 223.5 at SL = 99.99%, Z = 3.75, R = 200 + 37.5 = 237.5 So clearly, as the service level increases, the reorder point increases, which results in higher average inventory.
Section 10.7 Example 2. L = 9 days, and d = 12 units/day, and d = 24 units/day What is R at Service Levels of 99% and 99.99%? R = d L + ss = 216 + ss ss = Z L L = sqrt (9 x 122) = 36 at SL = 99%, Z = 2.35, R = 216 + 84.6 = 302.6 at SL = 99.99%, Z = 3.75, R = 216 + 135 = 351
Ch 11 Introduction • Production Planning is related to capacity planning, but it adds constraints related to time • Look at Figure 11.1 • Emphasis is on the time horizon (planning time) and the time buckets. • As we get to planning for short term (next few days) we add details, like the sequence of events and the time buckets become smaller (instead of a week plan, we plan for the shift).
Ch 11. Aggregate Planning • Time buckets = months • Time horizon = 2-4 months into the future and for several months • For example, we are in April, so a manufacturer performing Aggregate Planning today will be be planning for July 2002 – January 2003
Ch 11. Aggregate Planning • Based on demand for our products • But the demand is aggregate (therefore the name) so we do not know the specific demand per items we make, but overall demand for the typical mix • For example if we make TVs, we know typically we make 50% 25”, 30% 27”, and 20% 42”, so all the variables are based on this mix.
Ch 11. Aggregate Planning So look at the example in the text: • Demand • Dec 44,000 units • Jan 50,000 units • … • Process characteristics • 2 hours of labor per unit • Works for 1 shift (8 hours per day), 20 days in a month, thus each worker gives 160 hours per month • Current workforce = 550 workers • Cost Characteristics • Holding cost $2/month • ..
Ch 11. Aggregate Planning • The overall objective is to determine which strategy minimizes total cost over the planning horizon considered • Strategies determine • The workforce • The inventories • Buying from outside manufacturers (that make TVs for us)
Ch 11. Aggregate Planning • Strategy 1. Constant Workforce • How many workers we need to make the demand for the complete time horizon • Add demand for all six months = 277,000 units • How much time will it take to make 277,000 units, 554,000 hours (277,000 units x 2hrs.unit) • What is the time per worker in the same time span? • 160 hr/month x 5 months = 960 hours/worker • So how many workers? RU (554,000/960) = 578
Ch 11. Aggregate Planning • Given we have 550 to start with, we need to hire 28 workers in the first month. Starting workers Workers to hire Calculated before
What we can make 578 workers x 160 hours/ 2 hrs = 46,240 We do not outsource In this strategy Sum of what we Can make and what We buy outsource
Total Products – Required Units 2,240 x 2 We have this if Ending Inventory >0. If we have Negative inventory (backorders) We have 0 here.
578 workers x 160 hours x $10/hour = 924,800 28 workers hired x $200 We do not outsource in this strategy
Sum of all costs 934,880
Workers from the previous month We have the Number of workers we need
Workers from the previous month We need less as We we have inventory From last month 50,000 – 2,240 = 47,760
We can’t make all We need 46,240 – 47,760 = - 1,520 0 holding 1,520 x 5
And so on…. Lets plan for the three more months June July August 48,000 57,000 62,000 Workforce is at 700. All other stay variables stay the same
Class Example June July August 48,000 57,000 62,000 Sum = 167,000 units x 2hours = 334,000 hours Each worker gives 160 x 3 = 480 hours Thus the number of workers is 696.
Starting number of workers Layoff 4 to get to 696 696 x 160/2
1,130,960 1,126,320
TC: 3,370,960 1,130,960 1,126,320 1,113,680
Next strategy • Vary the workforce – each month find the number of workers each month that will meet the demand • This assumes workers are easily available. • For December we need how many workers? • 44,000 x 2 = 88,000/160 = 550 workers • Utilize Required units to calculate the number of workers
Vary the workforce • Same process as before • For Jan, 50,000 x 2/160 = 625, so hire 75 • Note that for May we use 39,960 to determine the number of workers • 39,960 x 2/160 = 500
Class Example • Lets apply strategy 2 to the next three months. • We have 700 workers • Demand for June is 48,000 • 48,000 x 2/ 160 = 600, so we need to layoff 100 workers
We do not outsource In this strategy 980,000
57,000 x 2/160 = 713 1,163,480 1,010,000
TC: 3,425,960 1,163,480 1,252,480 1,010,000
Third Strategy • Outsource • We keep the initial workforce • If we need more than we can make, buy from someone else (outsource) • Should be easy to follow on the course notes.
Third strategy for the class example • Modify workforce to a maximum of 50 (hire or layoff a max of 50), outsource any needed units
We only need 600 (48,000 x 2/160), But the maximum number Of workers that can be Changed is 50, so we have To keep extra workers
Given we really need 53,000 units The number of workers is 53,000 x 2/160 = 663
We need 61,960 units The number of workers is 61,960 x 2/160 = 775 But we can only hire 50
We outsource the difference of what is required and what we can make 61,960 – 57,040 = 4,920 Outsource cost 25 x 4,920 = 123,000 TC: 3,410,280
Results • Best strategy is to have a constant workforce based on total cost.
Ch 11. Intro to MRPSection 11.4 • MRP - intermediate level planning • Time buckets is typically in weeks • Plan for the next 2-16 weeks • Is based on product structure (the components) and lead time for the parent product and its components
Ch 11. Intro to MRPSection 11.4 Car • MRP Basics • If we have a car made of a body and two axle assemblies, we know we need 10 bodies and 20 Axle assemblies. • If it takes one week to make the car, two to make the body and five to make the axle assemblies. • W need 10 cars by week 9 then • We need to start making the cars in week 8 • We need to start the bodies in week 6 • We need to start the axle assemblies in week 3 Body Axle Assy (2) w1 w2 w3 w4 w5 w6 w7 w8 w9 car body Axle Assy