Download
1 / 75
800 likes | 1.47k Vues
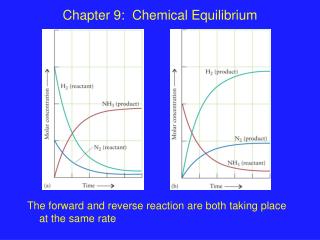
Chapter 7 Chemical Equilibrium The equilibrium composition corresponds to a minimum in Gibbs energy plotted against the extent of reaction . Standard Gibbs energy of reaction Δ r G Ø Equilibrium constant ( K ) Reactants Products

E N D
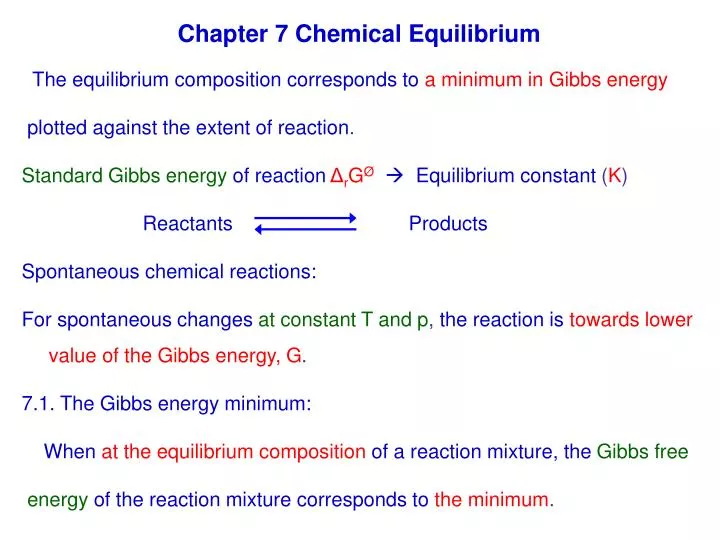
Chapter 7 Chemical Equilibrium The equilibrium composition corresponds toa minimum in Gibbs energy plotted against the extent of reaction. Standard Gibbs energyof reactionΔrGØ Equilibrium constant (K) Reactants Products Spontaneous chemical reactions: For spontaneous changesat constant T and p, the reaction istowards lower value of the Gibbs energy, G. 7.1. The Gibbs energy minimum: Whenat the equilibrium compositionof a reaction mixture, theGibbs free energyof the reaction mixture corresponds tothe minimum.
(a). The reaction Gibbs energy: A B Aninfinitesimal amount dεof A turns into B, dnA = – dε; dnB = dε Thereaction Gibbs free energy, ΔrG = (G/ε)p,T Δr Gsignifies a derivate, the slope of G with respect toε. dG = µA dnA + µBdnB = – µAdε + µBdε= (µB– µA) dε ΔrG = µB– µA µA: chemical potential of the A species; µ = (G/n)p,T µ = (nGm/n)P,T = Gm
ΔrG = µB– µA Because the chemical potentialsvary with composition(µ = µ0 + RT ln p), the slope of the plot of Gibbs energy against extent of reaction changes as the reaction proceeds. When, µA > µB; (ΔrG < 0) A B is spontaneous When µA < µB (ΔrG > 0) B A is spontaneous. When µA = µB (ΔrG = 0) The reaction mixture isat equilibrium
A and B are not mixed together. Not common case. A and B are mixed together. General case
Molecular interpretation 9.1 Without mixing: dG = GØ(B) dε – GØ(A) dε =ΔrGØdε pure A pure B Mixing: ΔmixG = nRT (A lnA + B lnB) For the real system: ΔrG = ΔG (no mixing) +ΔG (mixing) Therefore,the mixing procedurehas an important contribution to the position of the chemical equilibrium.
(b) Exergonic and endergonic reactions: The reactions for whichΔrG < 0are calledexergonic(work-producing). The reactions for whichΔrG > 0are calledendergonic(work-consuming). Reactions at equilibrium arespontaneous in neither direction, they are neither exergonic nor endergonic. In biological cells, the oxidation of carbohydrates act as the heavy weight that drive other reactions forwards and results in the formation of proteins, from amino acids, muscle contraction, and brain activity.
7.2 The description of equilibrium (a). Perfect gas equilibria: At constant T, dG = V dP Gm(pf) – Gm(pi) = RT ln(pf/pi) µ = µØ + RT ln p The relation between chemical potential and pressure of the perfect gas: dG = dH – TdS – S dT = dU + pdV +V dp –TdS = (TdS – pdV) + pdV + VdP – TdS – SdT = V dP – SdT; dG = Vdp – SdT
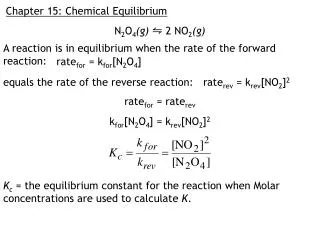
ΔrG = µB– µA = (µBØ + RT ln pB) – (µAØ + RT ln pB) = ΔrGØ + RT ln (pB/pA) =ΔrGØ + RTlnQ ( Q = pB/pA) Q: is an example of a reaction quotient (反應商數) The standard reaction Gibbs energy:ΔrGØ = GB,mØ – GA,mØ The difference in standard molar Gibbs energies of products and reactants is equal to the difference in the standard Gibbs free energy of formation. ΔrGØ = ΔfGØ(B) – ΔfGØ(A) At equilibriumΔrG = 0 RT lnK = –ΔrGØ ; K = (pB/pA)equilibrium ΔrGØ < 0 ; K > 1 ; pA < pB ΔrGØ > 0 ; K < 1 ; pA > pB
Justification : 2A + 3B C + 2D dnA = –2 dε; dnB = –3 dε; dnC = dε; dnD = 2dε (dnJ = vJdε) dG = µCdnC + µDdnD– µAdnA– µBdnB = (µC + 2µD–2µA– 3µB) dε [dG = ( vJµJ)dε] ΔrG = (G/ε)p,T = –2µA–3µB + µC + 2µD µJ = µJØ +RT ln aJ Q = aC aD2/aA2aB3 At equilibrium ΔrG = 0 K = (aC aD2/aA2aB3)equilibrium ; K = ( aJvJ )equilibrium J
Justification 7.1: The dependence of the Gibbs energy on the reaction quotient dG = µJdnJ = ( vJµJ)dε = (( vJµJ)) dε ΔrG = (G/ε)p,T = vJµJ µJ = µJØ +RT ln aJ ΔrG = ( vJµJ0) + RT vJ lnaJ = ΔrGo + RT ln aJvJ = ΔrGo+ RT ln aJvJ = ΔrGo+ RT lnQ At equilibrium ΔrG = 0 ; Q K K = (aC aD2/aA2aB3)equilibrium ; K = ( aJvJ )equilibrium J J J J J J J J
(b). The general case of a reaction: The Gibbs energy of reaction can always be written: ΔrG = ΔrGØ + RT lnQ With the standard reaction Gibbs energy: ΔrGØ = vΔfGØ - vΔfGØ General form:ΔrGØ = vJΔfGØ(J) The reaction quotient Q = activities of products / activities of reactants Q = aJvJ, for gas,aJ= fJ/pØ ; f: effective pressure, For pure solids and liquids, theactivity is 1, such substances make no contribution to Q. products reactants J
At equilibrium constant K expressedin terms of activitiesis called athermodynamic equilibrium constant. K = ( aJvJ ) equilibrium Because the activities aredimensionless, the thermodynamic equilibrium constant isalso dimensionless. On the other viewpoint, K or Q can have dimension, for exampleM-1, M-2….., atm-1, atm-2….. But ΔrG = ΔrGØ +RTlnQ, where, Q = (pp/pp0)/(pr/pr0) in such express is dimensionless, Consequently,the p unit must have the same unit as that of the standard state. For example:1.0 atm, 1.0 M
Molecular interpretation 7.2: (A B) Boltzmann distributiondoes not distinguish between their identities, only their energy. ΔrGØ = ΔrHØ – TΔrSØ ;K = exp(-ΔrHØ/RT)exp(ΔrSØ/R) Larger entropy
The response of equilibria to the conditions: The equilibrium constant for a reaction isunaffected by thepresence of a catalyst or an enzyme(a biological catalyst). Catalysts increase the rate (change the pathway), at which equilibrium is attained butdo not affect its position.
The responses of equilibria to the conditions 7.3 How equilibria response to pressure: The value of K (exp(– ΔrHØ/RT)exp(ΔrSØ/R)), isindependent of pressureat which the equilibrium is actually established. (K/p)T = 0 However, theequilibrium composition could change with the pressure. Case I: injecting an inert gas into a reaction vessel: Considering the ideal gas behavior, the partial pressures of the reacting gases are unchanged. (ptotal = preactant + pproduct + pinertgas) Thusthe presence of another gas has no effect.
Case II: the pressure of the system may be increased by confining gases to a smaller container. For instance, A 2B K = pB2/pApØ Tomaintain the constant K value, the relatively steep increase of pA compared to pB will occur. Thenthe number of the A will increaseas thevolume of the container is decreased. Le Chatelier’s principle: A systemat equilibrium, when subject toa disturbance, responds in a way thattends to minimize the effect of the disturbance.
A 2B Initial components: n of A (no B), At equilibrium: A is (1 – )n and the amount of B is (2n). A = (1– )/(1 + ); B = 2/ (1 + ) K = pB2/pA = B2p2/Ap = 42p/(1–2) = 1/(1 + 4p/K)1/2 Wherep = p/pØ ; relative pressure As p increases, the decreases. For N2 + 3 H2 2NH3 K = p2NH3/pN2pH23 = NH3p2/N2H2p4 = K/p2
7.4 The response of equilibria to temperature: Le chaterlier’s principle predicts: Exothermic reactions: increased temperature favors the reactants. Endothermic reactions: increased temperature favors the products. Exothermic reaction: Reactants Products + Energy Endothermic reaction: Reactants + Energy Products (a). The van’t Hoff equation: (1). dlnK/dT = ∆HrØ/RT2; (2). dlnK/d(1/T) = –ΔrHØ/R
Justification 7.2: lnK = –ΔrGØ/RT (ΔrGØ = ΔrHØ – TΔrSØ) dlnK/dT = –1/R[d(ΔrGØ/T)/dT] = ΔrHØ/RT2 d(1/T)/dT = – 1/T2, so dT = –T2 d(1/T) For a exothermic reaction: (ΔrHØ < 0) dlnK/dT (=ΔrHØ/RT2) < 0 As the temperature raises, the K value decrease, and the equilibrium shifts away from the products. The opposite occurs in the case of endothermic reactions. The other equation: dlnK/d(1/T) = –ΔrHØ/R
Molecular interpretation 7.3: A B Endothermic reactionExothermic reaction
Example 7.3: Ag2CO3(s) AgO2(s) + CO2(g) The original data are K value and Temperature. Mathematical conversion; – lnK vs. 1/T plot is linear. (dlnK/d(1/T) = ΔrHØ/R) Slope = ΔrHØ/R; Intercept = ΔrSØ/R (b). The value of K at different temperature: To find the value of the equilibrium constant at two different temperature: lnK2 – lnK1 = –ΔrHØ/R(1/T2 – 1/T1)
(b). The value of K at different temperature: To find the value of the equilibrium constant at two different temperature: lnK2 – lnK1 = – 1/R 1/T1 ΔrHØ d(1/T) If the ΔrHØ varies only slightly with temperature over the temperature range of interest. lnK2 – lnK1 = –ΔrHØ/R(1/T2 – 1/T1) Illustration of 7.6 N2+ 3 H2 2 NH3ΔrHØ/R = 2 ΔfHØ(NH3, g) ln K2 = ln K1 – (– 92.9 x 10³ J mol-1)/(8.314 JK-1 mol-1) (1/500K – 1/298 K) = – 1.71 K2 = 0.18 K1 (6.1 x 10⁵, 298 K) K2, the decrease in equilibrium constant indicates the synthesis of ammonia is an exothermic reaction. 1/T2
The extraction of metal from their oxides: In industrials, many metals can be obtained from oxides by reduction with C or CO: If any of the equilibria lie to the right (K > 1) MO(s) + C(s) M(s) + CO(g) MO(s) + ½ C(s) M(s) + CO(g) MO(s) + ½ CO(g) M(s) + CO2(g) To predict these above equation, we can use ΔrGØ of the measurable reactions. (i). M(s) + ½ O2(g) MO(s) (ii). ½ C(s) + ½ O2(g) ½ CO2(g) (iii). C(s) + ½ O2(g) CO(g) (iv). CO(g) + ½ O2(g) CO2(g)
Ellingham diagram ΔrGØ = ΔrHØ – TΔrSØ dΔrGØ/dT = –ΔrSØ For (i). net decrease in gas amount ΔrSØ < 0; slope < 0 For (ii). no net decrease in gas amount ΔrSØ = 0; slope =0 For (iii). net increase in the gas amount ΔrSØ >0; slope >0 For (iv). net decrease in the gas amount ΔrSØ < 0; slope < 0
MO(s) + C(s) M(s) + CO(g) ΔrGØ = ΔrGØ(iii) – ΔrGØ(i) MO(s) + ½ C(s) M(s) + CO(g) ΔrGØ = ΔrGØ(ii) – ΔrGØ(i) MO(s) + ½ CO(g) M(s) + CO2(g) ΔrGØ = ΔrGØ(iv) – ΔrGØ(i) For the case of ΔrGØ < 0, the line of reaction (i) lies below the line for one of the reactions (ii) to (iv).
The response of equilibria to pH pH = – log aH3O+ ; H3O+ : hydronium ion At low concentration, aH3O+ = [H3O+] (a). Acid-base equilibria in water: For an acid species HA: HA(aq) + H2O(l) H3O+(aq) + A-(aq); acidity constant Ka = aH3O+aA-/aHA; pKa = –log Ka For a base B B(aq) + H2O(l) HB+(aq) + OH-(aq) basicity constant Kb = aHB+aOH-/aB For water H2O: autoprotolysis 2 H2O(l) H3O+(aq) + OH-(aq) Kw = aH3O+aOH- (Kw = 1.008 x 10⁻¹⁴ at 25 oC; pKw = 14.0) pKw = pH + pOH
HA(aq) + H2O(l) H3O+(aq) + A-(aq); Ka A-(aq) + H2O(l) HA(aq) + OH-(aq) Kb Kw = KaKb (b). The pH of acid and base: Strong acids and bases are those for which the minimum Gibbs energy of the solution lies close to the products. In contrast, the minimum Gibbs energy of weak acids and bases lies close to the reactants.
For the weak acid, the extent of proton transfer is so small, Ka = [H3O+]2/[HA] ( [A-] = [H3O+] and [HA] [HA]0) pH = ½ pKa – ½ log [HA] For the weak base B, pOH = ½ pKb – ½ log [B] pH = pKW – pOH = pKw – ½ pKb + ½ log [B] (c). Acid base titration. Strong base (MOH), B0 At the stoichiometric point of the titration, VAA0 = VBB0 Weak acid, VA, A0
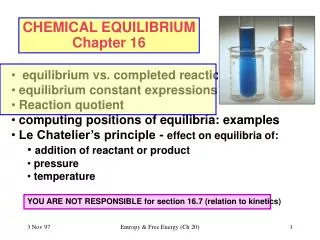
A pH curve of the titration of a weak acid with a strongbase IV III II I
At the start of titration: (I) pH = ½ pKa – ½ log A0 After the addition of some base: (II) HA(aq) + OH-(aq) A- + H2O(l) [A-] = S, S is the concentration of the salt from HA + MOH the molar concentration of the remained HA, A’ = (A0VA/V) – S Ka = aH3O+aA-/aHA aH3O+S/A’ pH = pKa – log A’/S (Henderson-Hasselbalch equation) The general form: pH = pKa – log [acid]/[base] At [acid] = [base]; pH = pKa The pH value of the half-way to the stoichiometric point.
At the stoichiometric point : (III) All of the HA was converted to A- [A-] S; Kb = aHAaOH-/aA- [OH-]2/S [OH-] = (SKw/Ka)1/2 ( pH = pKw – pOH) pH = ½ pKa + ½ pKw + ½ log S For titration of a weak base with a strong acid: pH = ½ pKa – ½ log S After well pat the stoichiometric point, (IV) the pH is determined by the excess base present, [H3O+] Kw/[OH-] pH = pKw + log B’
pKa (d). The ‘exact’ form of the pH curve When assume the activities of the solutes in the solution is equal to the concentration ( aA = [A]) a ‘exact’ equation of the pH curve can be obtained. ν= KaA0[H3O+] + (Kw – [H3O+]2)([H3O+ +Ka)/ ([H3O+] + Ka) ([H3O+]2 + B0[H3O+] –Kw) ν = VB/VA
(e) Using equilibria to stabilize pH: buffers Buffer action: the slow variation of the pH in the vicinity of S = A’ The pH value of the buffer: pH = pKa – log [acid]/[base] Exp. 0.20 M KH2PO4 + 0.10 M K2HPO4, pH = pKa(KH2PO4) – log (0.2/0.1) pH = 7.21 – 0.301 = 6.91
(f) Using equilibria to detect changes in pH: indicators An acid-base indicators must have a color change to detect the rapid change of pH near the stoichiometric point in a titration. Normally, they are some large, water-soluble, weakly acidic organic molecule. HIn(aq) + H2O(l) In-(aq) + H3O+(aq) KIn = aH3O+aIn-/aHIn log [HIn]/[In-] pKIn – pH Broadly speaking, 1. An indicator with pKIn > 7 is required for the stoichiometric point at pH > 7. 2. An indicator with pKIn < 7 is required for the stoichiometric point at pH < 7.
Equilibrium electrochemistry The ability to make very precise measurements of currents and potential differences (‘voltages’) means that electrochemical methods can be used to determine thermodynamic properties of reactions that may be inaccessible be other methods. Electrochemical cell: two electrodes + electrolyte (ionic conductor) electrode + electrolyte electrode compartment
A galvanic cell: an electrochemical cell can produce electricity as a result of the spontaneous reaction occurring inside it. An electrolytic cell: electrochemical cell in which a non-spontaneous reaction is driven by an external source of current. 7.5 Half-reactions and electrodes Oxidation: the removal of electrons from a species. Reduction: the addition of electrons to a species. Redox reaction: a reaction in which there is a transfer of electrons from one species to another. Reducing agent (or ‘reductant’): an electron donor in a redox reaction. Oxidizing agent (or ‘oxidant’): an electron acceptor in a redox reaction. Half‑reaction: a conceptual reaction showing the gain of electrons.
– ΔG or E Equilibrium Reaction extent In a galvanic cell, a spontaneous chemical reaction generate the push- and-pulling powers, and the extent of power depends on how close to the equilibrium. At equilibrium, ΔGr = 0 = we = - nFE E = 0 (no electrical potential).
Redox couple, the reduced and oxidized species in a half‑reaction. a couple: Ox/Red The corresponding reduction half-reaction: Ox + v e– Red Illustration 7.7 Expressing a recation in terms of half-reaction AgCl(s) Ag+(aq) + Cl–(aq) not a redox reaction AgCl + e– Ag(s) + Cl–(aq) Redox couple: AgCl/Ag, Cl– Ag(aq) + e– Ag(s) Redox couple: Ag+/Ag Reaction quotient: for a half-reaction, as for the reaction quotient for the overall reaction, but the electrons are ignored. Illustration 7.8 O2(g) + 4 H+(aq) + 4 e– 2 H2O reaction quotient Q = aH2O2 / (aH+4)(aO2) p0/ (aH+4)(pO2) aH2O = 1; the oxygen behaves as a perfect gas: aO2 pO2/p0
Anode, the electrode at which oxidation occurs. Red1 Ox1 + v e– Cathode, the electrode at which reduction occurs. Red2 + v e– Red2 In galvanic cell, the cathode has a higher (reducing) potential than the anode: the species undergoing reduction, Ox2, withdraws electrons from its electrode.
7.6 Varieties of Cells: The simplest type of cell has a single electrolyte. Daniel cell: different electrolyte Electrolyte concentration cell: a galvanic cell in which the electrode compartments are identical except for the concentrations of the electrolytes. Electrode concentration cell: a galvanic cell in which the electrodes themselves have different concentrations. (exp. Gas pressure or amalgams)
(a) Liquid junction potential Liquid junction potential, Elj, the potential difference across the interface of the two electrolytes. Between different concentrations of HCl, the mobile H+ diffuse into the more dilute solution. The bulkier Cl– ions follow, but initially do so more slowly, which results in a potential different at the junction. Electrolyte concentration cells always have a liquid junction; electrode concentrations cells do not. The concentration of the liquid junction to the potential by joining the electrolyte compartments through a salt bridge.
(b) Notation Cell notation: | phase boundary; liquid junction; || an interface at which the junction potential has been eliminated. Pt(s) | H2(g) HCl(aq) | AgCl(s) | Ag(s) A liquid junction is denoted by Zn(s) | ZnSO4(aq) CuSO4 | Cu(s) Zn(s) | ZnSO4(aq) || CuSO4 | Cu(s) Pt(s) | H2(g) | HCl(aq, b1) || HCl(aq, b2) | H2(g) | Pt(s)
7.7 The electromotive force Cell reaction: the reaction in the cell written on the assumption that the right-hand electrode is the cathode. Zn(s) | ZnSO4(aq) || CuSO4 | Cu(s) Right-hand electrode: Cu2+(aq) + 2 e– Cu(s) Left-hand electrode: Zn2+(aq) + 2 e– Zn(s) The overall cell reaction (right-hand half reaction substrates left-hand half reaction) Cu2+(aq) + Zn(s) Cu(s) + Zn2+(aq) (a) The Nernst equation: A cell in which the overall cell reaction has not reached chemical equilibrium can do electrical work as the reaction drives electrons through an external circuit.
ΔrG we (electric work) At constant pressure and temperature, the maximum non-expansion work (we) dwe, max = dG For a measurable change: we, max = ΔGr Justification: at constant temperature: dG = dH - T dS dG = dH – TdS = dU + pdV + Vdp = dq + dw + Vdp + pdV ; When the change is reversible, the work is maximum (wmax) dw = dwrev = dwe, rev – pdV; and dqrev = TdS dG = TdS + dwe, rev –p dV + Vdp + pdV dG = dwe,rev + Vdp, at constant p dG = dwe,rev = dwe, max .
Cell potential: the potential difference between the two electrodes of a galvanic cell. Electromotive force (emf): the cell potential when it is balanced by an exactly opposing source of potential so that the cell reaction occurs reversibly, the composition is constant, and no current flows. emf in terms of the reaction Gibbs energy, –vFE = ΔrG. Faraday’s constant, F = eNA. Justification 7.3 dG = rG d dG = dwe (maximum non-expansion work) dwe = rG d = (– ve NAd) E = (– vFd) E E: the potential difference between cathode and anode. dwe = – vFE d = rG d
Illustration 7.9 Converting emf rG If rG = – 1 x 10² kJmol-1 E = –rG / v F = ( – 1 x 10⁵ J mol-1)/ [1 x (9.6485 x 104 C mol-1)] = 1 V 1 J = 1 CV It is known that the reaction Gibbs energy is related to the composition of the reaction mixtureΔrG= rG0 + RT lnQ 1/vF E= rG0/ v F + (RT/ vF) lnQ Eo = ΔrG0/vF : standard emf E = Eo – (RT/vF) ln Q (Nernst equation) The equation for the emf of a cell in terms of the composition.
One important application of the Nernst equation is to the determination of the pH of a solution, with a suitable choice of electrodes, of the concentration of other ions. The standard emf can be interpreted as emf when all reactant and product in the cell reaction are in their standard sates. All activity = 1 Q = 1 lnQ = 0. Illustration 7.10 Because RT/F = 25.7 mV at 25oC, E = E0 – (25.7 mV/ v) ln Q If Q is increased by a factor of 10, then the emf decreases by 59.2 mV. (b) Cell at equilibrium: Suppose the reaction has reached equilibrium, then Q= K, E = 0. K: equilibrium constant for the cell reaction, ln K = FEo/RT
Illustration 7.11 K Eo The standard emf of the Daniel cell is +1.10 V, the equilibrium constant for the cell reaction Cu2+(aq) + Zn(s) ------> Cu(s) + Zn2+(aq), for which v = 2, is K = 1.5 x 1037. Large K the displacement of copper ion by zinc goes virtually to completion. 1.0 V is easily measurable. It would be impossible to measure by direct chemical analysis. 7.8 Standard potentials Although it is not possible to measure the contribution of a single cell, we can define the potential of one of the electrodes as zero and then assign values to others. Standard hydrogen electrode (SHE): Pt(s) | H2(g)| H+(aq) Eo = 0 at all temperature.
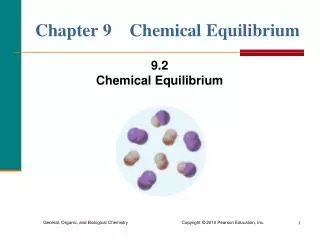
Standard potential of a couple, Eo,the standard emf of a cell in which a couple forms the right‑hand electrode and the standard hydrogen electrode is the left‑hand electrode. For a special case, the measurement is made on the ‘Harned cell’ Pt(s) | H2(g)| H+(aq) | AgCl(s) | Ag(s) ½ H2(g) + AgCl(s) HCl(aq) + Ag(s) E = E0(AgCl/Ag, Cl-) – (RT/ F) ln(aH+aCl-/aH21/2) We should set aH2 = 1 E = E0 – (RT/ F) ln(aH+aCl-) The activities can be expressed in term of the mobility b. aH+ = b/b0 ; aCl- = b/bo E = E0 – (RT/ F) lnb2 – (RT/ F) ln 2 E + (2RT/ F) ln b = E0 – (2RT/ F) ln
For a 1,1-electrolyte ln – b1/2 E + 2RT/F ln b = E0 + cb1/2 Illustration 7.12 Determining E0 The data of b and E were obtained. E + 2RT/F ln b and b1/2 Plot of E + 2RT/F ln b vs. b1/2 the intercept at b1/2 = 0 is the value of E0 for the silver/silver chloride electrode.