Download
1 / 21
210 likes | 315 Vues
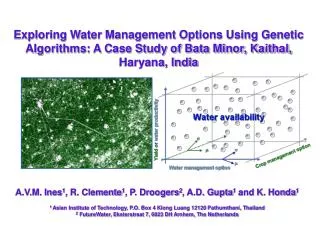
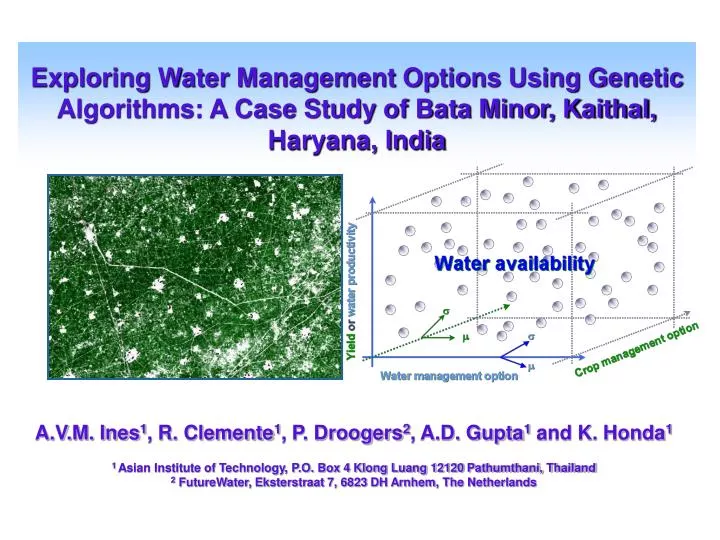
Exploring Water Management Options Using Genetic Algorithms: A Case Study of Bata Minor, Kaithal, Haryana, India. A.V.M. Ines 1 , R. Clemente 1 , P. Droogers 2 , A.D. Gupta 1 and K. Honda 1 1 Asian Institute of Technology, P.O. Box 4 Klong Luang 12120 Pathumthani, Thailand

E N D
Exploring Water Management Options Using Genetic Algorithms: A Case Study of Bata Minor, Kaithal, Haryana, India A.V.M. Ines1, R. Clemente1, P. Droogers2, A.D. Gupta1 and K. Honda1 1 Asian Institute of Technology, P.O. Box 4 Klong Luang 12120 Pathumthani, Thailand 2 FutureWater, Eksterstraat 7, 6823 DH Arnhem, The Netherlands
WATER VITAL FOR LIFE LIMITED VULNERABLE
A universe of options Water availability Yieldorwater productivity Crop management option Water management option
Water Management Optimization Model RS/GIS data Water Management Options Regional model General Framework of the Study System characterization DATA Genetic Algorithm
System Characterization [x, y] Irrigation dates, depths Spatial distribution yield t+2t t+t ETa water balance Extended SWAP SEBAL By Genetic Algorithm water productivity . . . t t+2t … t+t t+nt Past Time The future
Optimization of Water Management Strategies Formulation of the Water Management Model: Objective function: Subject to:
…Water Management Model Water management variables: Crop management variables:
…Water Management Model Where:
…Water Management Model By definition:
Regional mode SWAP model DATA Genetic Algorithm Water Management Options Schematic of WatProdGA (Water Productivity GA- based methodology) WatProdGA Decision Support Model
STUDY AREA The Study Area After Sakthivadivel et al., 1999 Bhakra Irrigation System, Haryana, India
Snapshot of Kaithal Irrigation Circle (Landsat 7ETM+) Kaithal Sirsa branch Bata minor (inset)
February 4, 2001 March 8, 2001 ETa, mm ETa, mm 2.90 2.48 2.06 1.64 1.22 4.20 0.80 3.44 m m 2.68 1.92 1.16 0.40 ETa in Bata Minor from SEBAL analysis
Classification Cropped area Cropped area February 4, 2001 March 8, 2001
60 60 SEBAL 50 50 SWAPGA 40 40 SEBAL 30 30 Rel. frequency, % SWAPGA Rel. frequency 20 20 10 10 0 0 <=1.9 1.9-2.1 2.1-2.3 2.3-2.5 2.5-2.7 >2.7 <=2.9 2.9-3.1 3.1-3.3 3.3-3.5 3.5-3.7 3.7-3.9 >3.9 ETa, mm ETa, mm GA solution to the regional inverse modeling February 4, 2001 March 8, 2001
System characteristics derived by GA * The mean and standard deviation were derived independently, so the values depended on the range between their prescribed maximum and minimum values. ** Sowing dates were represented by emergence dates in Extended SWAP.
How GA traps the solution Water Available 200 mm Max. fitness Yield Irrigation
Water Management Options Note: a rainfall of 91 mm was recorded during the simulation period a Irrigation scheduling criterion, Ta/Tp, the level of water stress allowed before irrigation. b Sowing dates, represented here by the emergence dates (eDate); Std. Dev. is in number of days.
Optimized distribution of irrigation, yield, PWIrrigated, PWDepleted and PWProcess when the average water supply is around 300 mm.
Optimized distribution of irrigation, yield, PWIrrigated, PWDepleted and PWProcess when the average water supply is around 500 mm.