Download
1 / 13
130 likes | 243 Vues
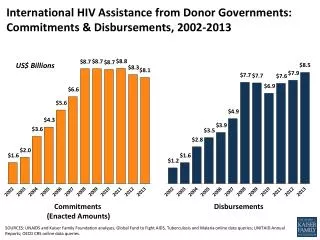
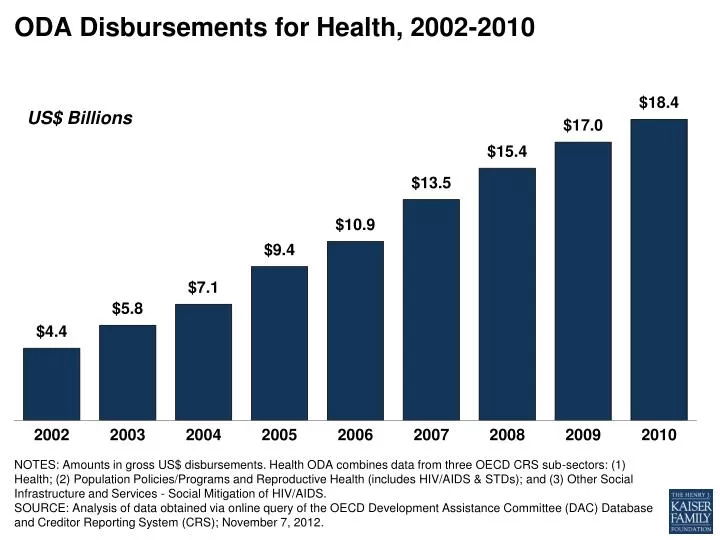
ODA Disbursements for Health, 2002-2010. US$ Billions.

E N D
ODA Disbursements for Health, 2002-2010 US$ Billions NOTES: Amounts in gross US$ disbursements. Health ODA combines data from three OECD CRS sub-sectors: (1) Health; (2) Population Policies/Programs and Reproductive Health (includes HIV/AIDS & STDs); and (3) Other Social Infrastructure and Services - Social Mitigation of HIV/AIDS. SOURCE: Analysis of data obtained via online query of the OECD Development Assistance Committee (DAC) Database and Creditor Reporting System (CRS); November 7, 2012.
Total ODA Disbursements, 2002-2010 US$ Billions * ODA in 2005 and 2006 was higher than previous and subsequent years due to scheduled and significant additional debt relief transactions. NOTES: Amounts in gross US$ disbursements. Health ODA combines data from three OECD CRS sub-sectors: (1) Health; (2) Population Policies/Programs and Reproductive Health (includes HIV/AIDS & STDs); and (3) Other Social Infrastructure and Services - Social Mitigation of HIV/AIDS. SOURCE: Analysis of data obtained via online query of the OECD Development Assistance Committee (DAC) Database and Creditor Reporting System (CRS); November 7, 2012.
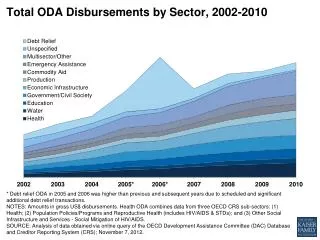
Total ODA Disbursements by Sector, 2002-2010 * Debt relief ODA in 2005 and 2006 was higher than previous and subsequent years due to scheduled and significant additional debt relief transactions. NOTES: Amounts in gross US$ disbursements. Health ODA combines data from three OECD CRS sub-sectors: (1) Health; (2) Population Policies/Programs and Reproductive Health (includes HIV/AIDS & STDs); and (3) Other Social Infrastructure and Services - Social Mitigation of HIV/AIDS. SOURCE: Analysis of data obtained via online query of the OECD Development Assistance Committee (DAC) Database and Creditor Reporting System (CRS); November 7, 2012.
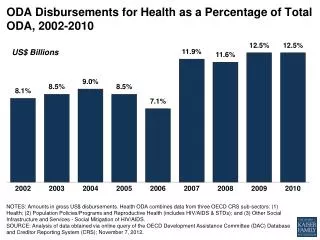
ODA Disbursements for Health as a Percentage of Total ODA, 2002-2010 US$ Billions NOTES: Amounts in gross US$ disbursements. Health ODA combines data from three OECD CRS sub-sectors: (1) Health; (2) Population Policies/Programs and Reproductive Health (includes HIV/AIDS & STDs); and (3) Other Social Infrastructure and Services - Social Mitigation of HIV/AIDS. SOURCE: Analysis of data obtained via online query of the OECD Development Assistance Committee (DAC) Database and Creditor Reporting System (CRS); November 7, 2012.
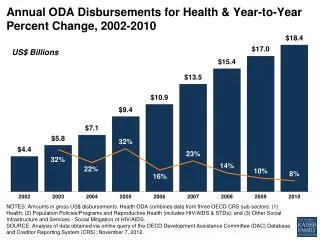
Annual ODA Disbursements for Health & Year-to-Year Percent Change, 2002-2010 US$ Billions NOTES: Amounts in gross US$ disbursements. Health ODA combines data from three OECD CRS sub-sectors: (1) Health; (2) Population Policies/Programs and Reproductive Health (includes HIV/AIDS & STDs); and (3) Other Social Infrastructure and Services - Social Mitigation of HIV/AIDS. SOURCE: Analysis of data obtained via online query of the OECD Development Assistance Committee (DAC) Database and Creditor Reporting System (CRS); November 7, 2012.
Top 10 Donors for Health ODA, 2002 &2010 2010 2002 Total = $18.4 billion Total = $4.4 billion NOTES: Amounts in gross US$ disbursements. Health ODA combines data from three OECD CRS sub-sectors: (1) Health; (2) Population Policies/Programs and Reproductive Health (includes HIV/AIDS & STDs); and (3) Other Social Infrastructure and Services - Social Mitigation of HIV/AIDS. SOURCE: Analysis of data obtained via online query of the OECD Development Assistance Committee (DAC) Database and Creditor Reporting System (CRS); November 7, 2012.
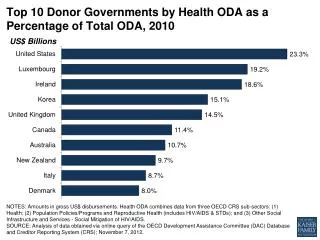
Top 10 Donor Governments by Health ODA as a Percentage of Total ODA, 2010 US$ Billions NOTES: Amounts in gross US$ disbursements. Health ODA combines data from three OECD CRS sub-sectors: (1) Health; (2) Population Policies/Programs and Reproductive Health (includes HIV/AIDS & STDs); and (3) Other Social Infrastructure and Services - Social Mitigation of HIV/AIDS. SOURCE: Analysis of data obtained via online query of the OECD Development Assistance Committee (DAC) Database and Creditor Reporting System (CRS); November 7, 2012.
Top 10 Donor Governments by Health ODA per US$1 Million GDP, 2010 US$ Billions NOTES: Amounts in gross US$ disbursements. Health ODA combines data from three OECD CRS sub-sectors: (1) Health; (2) Population Policies/Programs and Reproductive Health (includes HIV/AIDS & STDs); and (3) Other Social Infrastructure and Services - Social Mitigation of HIV/AIDS. SOURCE: Analysis of data obtained via online query of the OECD Development Assistance Committee (DAC) Database and Creditor Reporting System (CRS); November 7, 2012.
Health ODA Disbursements by Region, 2002-2010 NOTES: Amounts in gross US$ disbursements. Health ODA combines data from three OECD CRS sub-sectors: (1) Health; (2) Population Policies/Programs and Reproductive Health (includes HIV/AIDS & STDs); and (3) Other Social Infrastructure and Services - Social Mitigation of HIV/AIDS. SOURCE: Analysis of data obtained via online query of the OECD Development Assistance Committee (DAC) Database and Creditor Reporting System (CRS); November 7, 2012.
Major Sub-Sector Share of Health ODA, 2002 & 2010 2010 2002 Total = $18.4 billion Total = $4.4 billion NOTES: Amounts in gross US$ disbursements. Health ODA combines data from three OECD CRS sub-sectors: (1) Health; (2) Population Policies/Programs and Reproductive Health (includes HIV/AIDS & STDs); and (3) Other Social Infrastructure and Services - Social Mitigation of HIV/AIDS. SOURCE: Analysis of data obtained via online query of the OECD Development Assistance Committee (DAC) Database and Creditor Reporting System (CRS); November 7, 2012.
Health ODA Disbursements by Major Sub-Sector, 2002-2010 NOTES: Amounts in gross US$ disbursements. Health ODA combines data from three OECD CRS sub-sectors: (1) Health; (2) Population Policies/Programs and Reproductive Health (includes HIV/AIDS & STDs); and (3) Other Social Infrastructure and Services - Social Mitigation of HIV/AIDS. SOURCE: Analysis of data obtained via online query of the OECD Development Assistance Committee (DAC) Database and Creditor Reporting System (CRS); November 7, 2012.
Change in Health ODA Disbursements by Major Sub-Sector, 2009-2010 US$ Billions Nutrition Other Infectious Diseases NOTE: Amounts in gross US$ disbursements. Health ODA combines data from three OECD CRS sub-sectors: (1) Health; (2) Population Policies/Programs and Reproductive Health (includes HIV/AIDS & STDs); and (3) Other Social Infrastructure and Services - Social Mitigation of HIV/AIDS. SOURCE: Analysis of data obtained via online query of the OECD Development Assistance Committee (DAC) Database and Creditor Reporting System (CRS); November 7, 2012.
ODA Disbursements for Water, 2002-2010 US$ Billions NOTES: Amounts in gross US$ disbursements. Health ODA combines data from three OECD CRS sub-sectors: (1) Health; (2) Population Policies/Programs and Reproductive Health (includes HIV/AIDS & STDs); and (3) Other Social Infrastructure and Services - Social Mitigation of HIV/AIDS. SOURCE: Analysis of data obtained via online query of the OECD Development Assistance Committee (DAC) Database and Creditor Reporting System (CRS); November 7, 2012.