Download
1 / 7
70 likes | 204 Vues
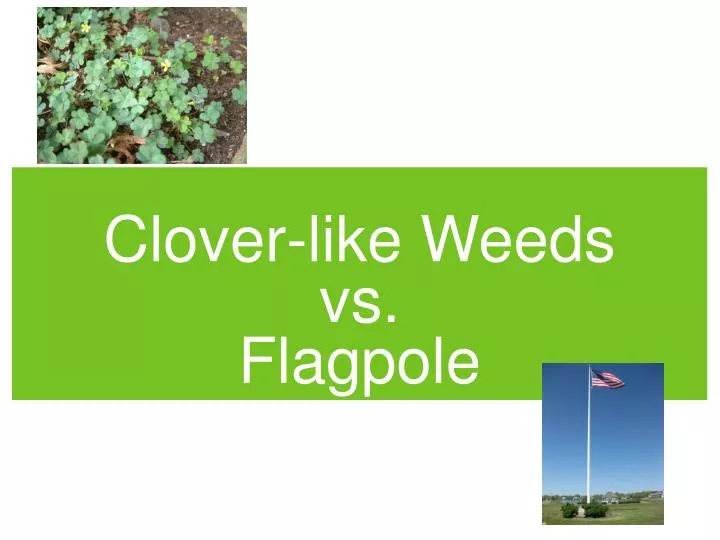
Clover-like Weeds vs. Flagpole. Hypothesis. If the flagpole was not there, then the population density of the clover-like weeds would increase. Experimental Design.

E N D
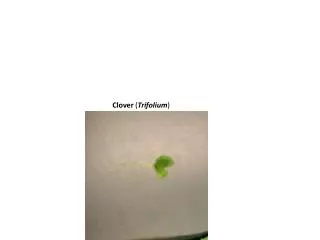
Hypothesis • If the flagpole was not there, then the population density of the clover-like weeds would increase.
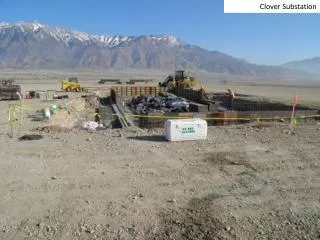
Experimental Design • Independent Variable: Distance from the flagpole. From the flagpole to the weeds, we used six inch and two inch intervals to measure the population density. For example, the first measure was 0 inches. Second, 6 inches, third 12 inches, etc. • Dependent Variable: Population density of clover-like weeds. The number of weeds in the grass depended on the distance form the flag pole. We used a 3x3 measuring tool to measure the population density. • Constants: The placement of the flagpole, the flagpole will never move, so we can depend on it. The temperature in the environment, it wont change to drastically in a short amount of time, so we can depend on that. The 3in x 3in measuring tool(6 inches vertically, 2 inches horizontally), throughout the whole process we used the same measuring tool.
Diagram of Experiment • First we used the ruler to measure the distance from the flagpole to the weeds, using 6 inch intervals, then we used the 3x3 measuring tool to measure the population density. Then we measured 2 inches away from that 3x3 tool and measured again.
Our Data Average # of Clovers
Conclusion • The clover like weeds need a specific type of grass that they desire to grow in. From our data, we saw that the weeds did not grow in the area the cement and dirt were and where the grass was green and healthy. The clover like weeds grew more in the yellow/dried-up grass. This is because they do not need to have as fertile soil as the green, healthy grass needs. This is shown in our data and graph: from zero to 18 inches there were no clover-like weeds, because that was where the cement and dirt was. Then at 30 inches the weeds population started to fall, because that was where the healthy grass started to grow. Our findings would represent the actual population in a very accurate way. This is because in the actual populations environment most of the weeds would not grow anywhere on cement or dirt and not in very healthy grass. If we did this again we would use different measuring tools to measure the amount of weeds and use a meter stick instead of a 12 inch ruler, because it would give us more accurate data. Also next time we will not only count weeds in one area, but also in other ares to.